
I made my first visit to Papua New Guinea in 2006. The economy was doing well. Commodity prices were high, and revenue was pouring in. If back then someone had predicted that a decade on government revenue would be lower than it was at the time, I simply wouldn’t have believed them. No-one could be sure how long the commodity price boom would last. Revenue growth might slow. There would be bad years as well as good. But it was out of the question that overall revenue would not grow over time. In hindsight, I was too conditioned by my previous decade of work on Asian economies such as India and Indonesia where an upward trajectory in government revenue is taken for granted.
Today in PNG, adjusting for inflation, government revenue is expected to be below its 2006 level. Revenue from big resource projects, which in 2006 was about K3 billion in today’s prices, has all but disappeared. Revenue from the broader economy is higher than it was in 2006, but has fallen sharply since 2014, and the remaining increase is not enough to make up for the disappearance of resource revenues.
Government revenue adjusted for inflation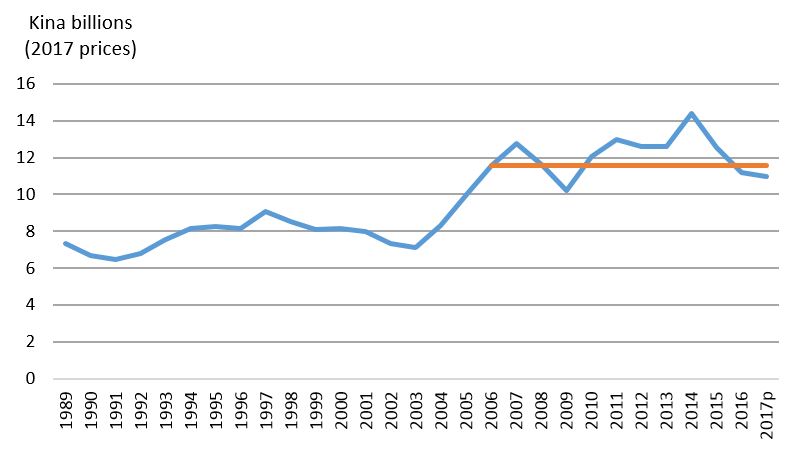
The orange line shows 2006 levels. Years with suffix “p” refer to projected figures.
What about expenditure? Back in 2006, there was no government borrowing. Now borrowing is at record levels. So expenditure is back at 2011 or 2012 rather than 2006 levels. But that makes things sound better than they really are. Salaries have increased massively. So has the interest bill. Both of these variables are difficult to change quickly. They are committed rather than discretionary expenditures. Take out salaries and interest, and discretionary spending is also back at below 2006 levels.
Government discretionary expenditure (excluding salaries and interest) adjusted for inflation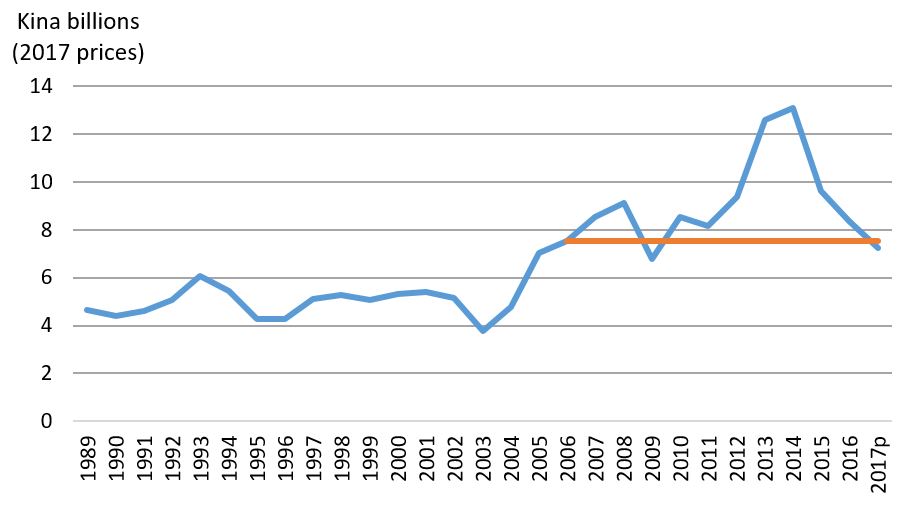
The orange line shows 2006 levels.
Back in 2006, money was coming in so fast that the government didn’t know how to spend it. But things are far tighter now. For a start the population is 30% larger. There was no free education in 2006 (now worth K600 million). Payments to the provinces and districts are now much larger. And there are huge government arrears of unpaid bills and overdue superannuation contributions.
It’s a sobering story, summarized by the third graph below, which compares 2006 with 2016 and 2017. In fact, you can see that the return to 2006 levels first happened in 2016 (and I wrote about it then). This year, the decline has gone even further.
Comparing government revenue and discretionary expenditure in 2006, 2016 and 2017

At the time, 2006 seemed to be near the beginning of PNG’s boom. In Port Moresby the boom has continued. Its shopping malls and traffic jams make for a very different experience compared to when I first visited. But, as this analysis shows, government revenue has not kept pace with the economy. That is why the PNG government as a whole is facing the very same expenditure problems people were talking about when I first arrived: police with no cars, police cars with no petrol, roads with no maintenance. The recent DFAT assessment of aid to PNG notes that current government funding for road maintenance is “equivalent to 2010 levels and is insufficient to prevent further decline in the aggregate condition of Papua New Guinea’s national road network.”
The underlying problem is the failure of revenue to grow in a sustained manner. As we show in our 2017 PNG Survey, per capita revenue is below its 1990 level. As the World Bank has shown in its recent Pacific Possible report, PNG’s per capita revenue is the lowest in the Pacific.
There is no simple way out. The return of revenue and discretionary expenditure to the levels of a more than a decade earlier should be a wake up call. It needs to be shared by the PNG Government with MPs and the people in order to explain the need for tough measures and difficult reforms.
In our 2017 PNG Economic Survey, we argue for a depreciation of PNG’s overvalued exchange rate to stimulate the economy to create jobs and boost revenue. Expenditure prioritization is also critical. With revenue back below 2006 levels, PNG simply can’t afford new universities and large MP funds.
Stephen Howes is Director of the Development Policy Centre. The analysis in this blog draws on the ANU-UPNG 2017 PNG Economic Survey, a seminar on which will be held at the Australian National University this Wednesday 11 October at 12.30pm (the podcast from this seminar can be found here). The 2017 figures are from the recent supplementary budget.

How is it possible that extractives revenues have disappeared when copper and oil prices are comparable today to 2006, gold has doubled in price, and a new gas industry has been developed?!
That’s a really good question. The old oil wells are running out, the gold mines never seem to pay tax, the PNG LNG project is not paying tax, and I’m not sure about Ok Tedi. Either it is not paying tax now because it shut down as a result of the drought in 2015 and/or because it is investing in a mine-life extension. It would be really good to see some more research on this topic though.
Unfortunately very few PNG nationals pay tax, in fact even as early as the 1990’s a tax team went to Milne Bay province and gave business leaders there a talk on tax. the leaders there formed a committee and advised the visiting team that they did not want taxation there.
This is putting more and more pressure by the tax and customs departments on the few honest companies left paying taxation in PNG combined with non or very late payment by the government with the result that many are now either failing or deciding to leave PNG resulting in even less revenue.