PNG real revenue back to 2006 levels
By Rohan Fox and Stephen Howes
22 August 2016
The 2016 Papua New Guinea Mid-year Economic and Fiscal Outlook (MYEFO) released at the end of July tells a sobering tale. 2016 revenue adjusted for inflation is back at the same level as it was a decade ago in 2006.
Figure 1 shows total government revenue (including grants) back to 2000, adjusted for inflation. Comparisons are slightly complicated by the fact that PNG Treasury changed its fiscal accounting standards last year, but, in fact, as Figure 1 shows, this makes little difference on the revenue side.
Figure 1: Revenue (including grants) adjusted for inflation, 2000 to 2016
 adjusted for inflation, 2000 to 2016")
Source and notes for all figures: Treasury budget documents and BPNG; PNG Treasury switched this year from GFS1986 to GFS2014 accounting standards*; 2016 are MYEFO estimates; earlier years are actuals. The data presented in this post can be found in this Excel spreadsheet [.xlsx].
With population some 25% greater than a decade ago, it’s a dire situation for service delivery and infrastructure.
Why is revenue back at 2006 levels? After all, the size of the economy has more than doubled.
Revenue has fallen for the last two years. Last year it fell by 14% back to 2013 levels, and this year it is estimated to have fallen another 6% back to 2006 levels (all growth rates in this post adjusted for inflation). The falls are dramatic, and far more than were predicted by earlier post-oil-price-crash forecasts at the end of 2014. It is fair to say that no-one saw this coming.
But this is not just a story about the last two years. The fact that revenue has slipped back so far (from 2013 to 2006 levels) in just one year (the current one) shows how little revenue growth there has been over the last decade. Even in 2014, revenue was only 20% above 2006 levels. Revenue grew rapidly to 2007, increasing by 50% from 2000. But then it slowed down, and revenue has exceeded 2007 levels only once, in 2014.
Figure 2 shows that economy-wide taxes (taxes other than those from the mining and petroleum sectors) have grown significantly over the last decade. They almost doubled between 2006 and 2014. They have since fallen by 17%, but are still some two-thirds bigger than they were in 2006. But that gain of K3.1 billion in economy-wide taxes between 2006 and 2016 has been offset by an almost identical fall in mining and petroleum taxes, which have virtually disappeared falling from K3.3 billion to 2006 to just K0.2 billion this year. Non-tax revenues and grants are also smaller once you adjust for inflation.
Figure 2: Different revenue sources, 2006, 2014 and 2016

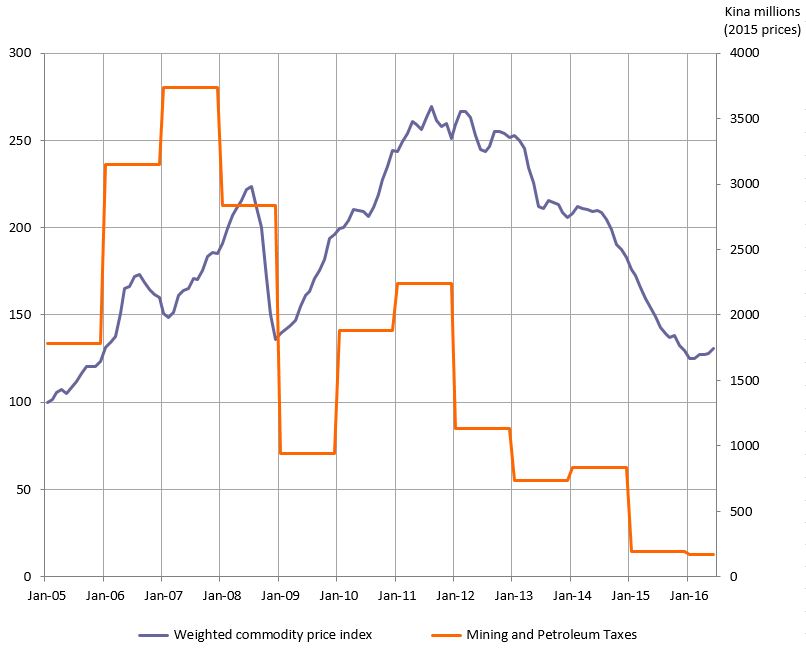
At first, this sounds like a story of falling commodity prices, but it is more complex than that. We have constructed a commodity price index for PNG based on the resources it exports, and adjusting for inflation. That index is back today at almost exactly 2006 levels. And, as Figure 3 also shows, mining and petroleum tax revenues have been in decline since 2007, even though the commodity price index only really started falling in 2013.
Figure 3: Commodity index and mining & petroleum taxes, 2006 to 2016
Source: Treasury budget documents and IMF, commodity price index weighted according to PNG export value ratios using data from the MIT Atlas of Economic Complexity.
Copper and oil prices are down (copper by 42% from 2006 to 2015 and oil by 62% adjusted for inflation). But on top of this, PNG’s older oil and Ok Tedi projects have been producing less over time. Oil production is down from 14.5 million barrels in 2006 to an estimated 5.3 million this year, and copper from 217 million tonnes to 57 million. (Gold is an exception, with its price and quantity up, but PNG’s gold projects do not seem to yield government revenue.) The new projects – Ramu Nickel and PNG LNG – are simply not yielding government revenue due to not only low commodity prices but also tax holidays and/or accelerated depreciation.
One can make the same point in terms of tax-to-GDP ratios, which are shown in the final figure. PNG’s overall tax to GDP ratio rose from 20% in 2002 to 31% in 2007, but then started to fall, and this year is as low as 16%. Outside of the mining and petroleum sector, the tax/output ratio has been consistently in the much narrower range of 22-26%, and is now at 24%. Mining and petroleum taxes as a percentage of mining and petroleum output rose from 10% in 2002 to a maximum of 42% in 2007, but then started to plummet and this year are less than 1%.
Figure 4: Ratios of taxes to output, 2002 to 2016

Note: Mineral and petroleum taxes are divided by mineral and petroleum output, and economy wide taxes are divided by GDP minus mineral and petroleum output.
What can be done? It will take several years before tax holidays and accelerated depreciation wear off and the PNG LNG and Ramu Nickel projects become significant tax payers.
The government has both limited borrowing capacity and limited policy options to boost its economy-wide revenue. With the economy in the doldrums it is naturally reluctant to increase taxes. But it could look at tax administration. In this regard the apparently overlooked Tax Reform Commission could provide a good starting point. A less generous approach to fiscal concessions would also be sensible.
The one policy lever the government has to stimulate the economy (and thereby revenues) is the exchange rate. There was some limited nominal exchange rate depreciation since the Central Bank took control of the exchange rate in mid-2014, but that seems to have ended in April, and the exchange rate has been flat since. Given that the real exchange rate is still at a very high level, and that other oil-exporters have depreciated much more, there is plenty of scope for further devaluation.
Another policy imperative is expenditure restructuring. Expenditure policies have to be set not just to cope with another annual revenue shortfall, but on the basis that revenue are where they were a decade ago, and are unlikely to change much for the next few years. What may have seemed affordable a couple of years ago no longer is.
Rohan Fox is a Research Officer at the Development Policy Centre. Stephen Howes is the Centre’s Director.
*Correction (6 September 2016): The analysis refers to GFS2014, not GFS2012 as originally published.
Notes:
- This analysis assumes that the MYEFO mid-year forecasts of revenue for 2016 are accurate. Last year’s MYEFO estimate for revenue (including grants) overestimated the final outcome by only 4%. Last year’s estimate was based on 40% of the revenue and grants to date having been collected (relative to the new estimate). This year’s ratio is very similar, 38.6%.
- With the sovereign wealth fund, half of mineral and petroleum taxes are accounted for as grants rather than revenue in 2016. We have adjusted 2016 taxes to reverse this.
- The old GDP series is used, as the new one is only available for 2006-2013. For the most recent years, 2016 budget figures are used for GDP.
About the author/s
Rohan Fox
Rohan Fox was a Research Officer at the Development Policy Centre. He lectured in the economics program at the University of Papua New Guinea in 2015, 2016 and 2020.
Stephen Howes
Stephen Howes is Director of the Development Policy Centre and Professor of Economics at the Crawford School of Public Policy at The Australian National University.
