The changing composition of PNG’s foreign workforce
By Carmen Voigt-Graf
16 March 2015
This is the fourth in a series of posts analysing arrival and departure data in Papua New Guinea.
So far, we have seen that the number of arrivals to PNG has increased enormously over the last decade, on account of the country’s economic boom. Australia has remained the predominant source country of visitors to PNG, contributing about half of all visitors, but Asia has been the fastest growing source region, with the number of visitors from the Philippines increasing particularly rapidly. In this post, I will show that different factors are driving growth from different source regions.
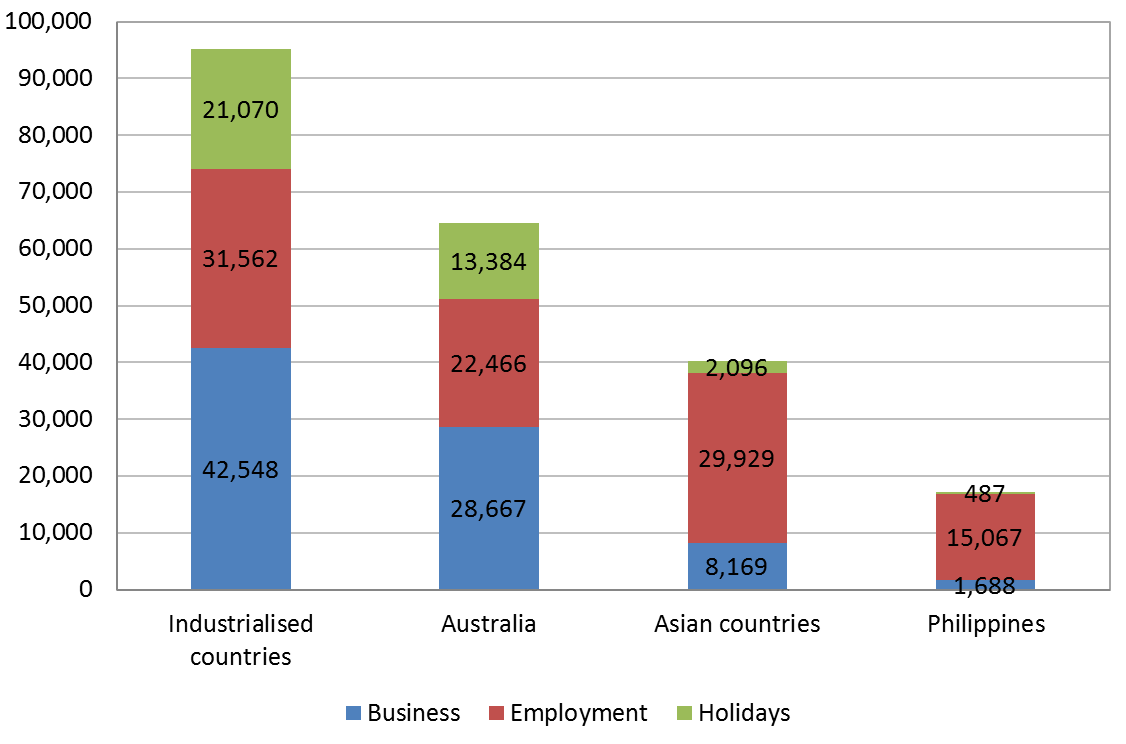
The last year for which annual data is available from the National Statistics Office (NSO) for the country of residence by reason of visit is 2012. This shows remarkable differences in the reasons to visit PNG between regions of origin. Figure 1 shows the reasons for visitor arrivals from industrialised countries in comparison to the reasons for visitor arrivals from developing Asian countries (except for the industrialised Asian countries of Singapore, Japan and Korea). The reasons for visitor arrivals from the two largest countries of residence, Australia and the Philippines, are displayed separately, as well as being included in the categories of industrialised and developing Asian countries respectively.
Figure 1: visitor arrivals by reason of visit, 2012
The main reason for visitor arrivals from industrialised countries is business: 40% of visitors from industrialised countries went to PNG for business reasons. In contrast, the main reason for visitors arriving from Asian countries is employment (69.6%). As many as 82.3% of Filipinos went for employment reasons. From all countries in the world, the Philippines has the largest percentage of employment-related visitor arrivals to PNG, followed by the Indian subcontinent (76.5%). Since many visitors from Asia arrive for employment, they usually stay in PNG for longer periods of time compared to the business arrivals, who tend to stay for short periods of time.
The Philippines was already the second most important source country for arrivals for employment purposes in 2000. The country has retained this rank, but the absolute number of arrivals for employment purposes from the Philippines increased from 1,232 in 2000 to 15,067 in 2012, that is, from just 15% of the Australians arriving for employment to 67%. At this rate the Philippines will soon overtake Australia as the main source country of new foreign employees (see Figure 2).
Figure 2: number of visitors for employment from Australia and the Philippines
 Note: Data on the number of visitors by country of residence and reason is incomplete for 2006.
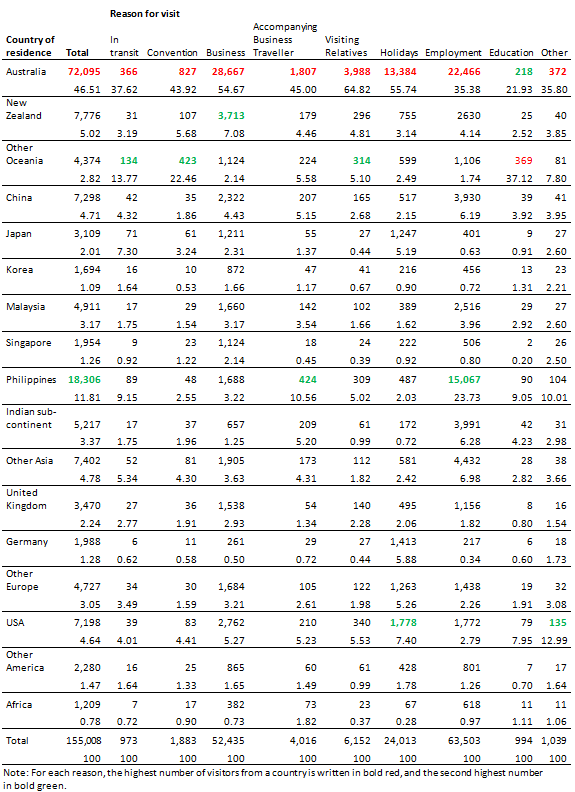
Tables 1 and 2 in the Annex to this post provide detailed information on visitor arrivals by country of residence and reason for the years 2000 and 2012 respectively. Only countries that contributed more than 1% of visitor arrivals are included in the tables. In 2000 and 2012, the largest number of visitors for each reason came from Australia, except for visitors arriving for education purposes, where the highest number came from Oceania in both years.
Focussing on employment-related visitor arrivals, Figures 3 and 4 show the declining proportion of employment-related visitor arrivals from Australia and other developed countries. In 2000, 76% of visitors for employment-related purposes came from developed countries, while this proportion had declined to 49% in 2012. Over this time, the share of employment-related visitors from developing countries increased, especially from Asian developing countries (with the exception of Malaysia).
Bear in mind that this increase in the sourcing of workers from developing countries is occurring in a context in which foreign workers have become much more important in PNG. As I showed in my second post in this series, between 1996 and 2013 the number of workers in the formal employment sector in PNG increased by about 1.5 times to 340,000. The number of foreign visitors increased 2.7 times to 168,000, but the number of visitors for employment increased 5.3 times to 70,000. Even allowing for some suspected underestimation of the formal workforce numbers in recent years, these numbers clearly suggest that PNG is relying more heavily on overseas workers. The ratio of visitors for employment to total formal employment increased from 6% in 1996 to 21% in 2013. Presumably, a key attraction of developing-country workers is that they cost less to hire than their industrialised-country counterparts. To this extent, greater reliance on them has driven the turn towards greater reliance on foreign employment. It is also a credit to PNG’s foreign work permit system that it has been able to facilitate this rapid growth.
Figure 3: source countries of visitors for employment purposes, 2000

Figure 4: source countries of visitors for employment purposes, 2012

The focus of Figure 5 is on Australia’s share of total visitors to PNG since 2000. It has oscillated around the 50% mark but was lowest in 2012 (46.5%). We have already seen that Australia’s share of visitors for employment purposes has gradually decreased. In contrast, since 2000 Australia’s share of business visitors was consistently above 50%, peaking in 2004 (67.4%). Australia’s share of holiday-makers has increased in recent years and has remained above 50% since 2008, although the total number of holiday-makers in PNG has actually fallen. More analysis on tourist arrivals will be provided in a forthcoming post.
Figure 5: Australians as percentage total, employment, business and holiday visitors
 Note: Data on the number of visitors by country of residence and reason is incomplete for 2006.
In sum, the increasing number of Asian visitors, and especially Filipinos, to PNG for employment purposes since 1999 has been an important development. It is directly linked to PNG’s expanding economy, and shows that Filipinos in particular, as well as Asians more generally, have been successful in accessing increased employment opportunities associated with this expansion. Equally striking is the diversification of the foreign workforce, though not of foreign business people, away from its former domination by Australia. Australians continue to dominate arrivals for business and holiday purposes, contributing more than half of the visitors in each category. Australia’s growing domination of the holiday market has roughly offset its falling importance in the foreign worker category, which explains why Australia’s overall share in foreign arrivals is roughly constant, as my previous post showed.
Notes:
- Data refers to the country of residence rather than the country of nationality of visitors, which is also available. In general, the numbers for both categories are similar. The reason for country of residence being used in this analysis is that people usually have only one country of residence, but can have more than one nationality, possibly leading to inconsistencies when using the nationality category.
- The data on country of residence of visitor arrivals by reason for visits is currently only available between 2000 and 2012. The 2013 data is likely to be released soon by the NSO.
- PNG was included as a country of residence in 2004 and 2005 but it is unclear even to the NSO how these numbers came about and subsequently went back to zero. It is also unclear why 4,929 visitors did not state their country of residence in 1999, while the subsequent number of visitors not stating their country of residence was zero or minute.
- The tables released by the NSO include the following countries of residence: Papua New Guinea, Australia, New Zealand, Other Oceania, China, Japan, Hong Kong, Malaysia, Singapore, Philippines, Indian sub-continent, Korea, Other Asia, United Kingdom, Germany, France, Other E.E.C, Other Europe, USA, Canada, Other America, Africa, Russia, Italy, Scandinavia, Chile, Israel, and not stated. Russia, Italy, Scandinavia, Chile, and Israel have only been included since 2007, while previously visitors from these countries had been subsumed into general categories.
Carmen Voigt-Graf is a Fellow at the Development Policy Centre, and a Senior Research Fellow at the National Research Institute in Papua New Guinea.
Annex: Table 1: visitor arrivals by reason and country of residence, 2000

Table 2: visitor arrivals by reason and country of residence, 2012
About the author/s
Carmen Voigt-Graf
Carmen Voigt-Graf was a Fellow at the Development Policy Centre from 2014 to 2017 as well as a Senior Fellow at Papua New Guinea’s National Research Institute.
