Kerri Viney recently blogged about the co-epidemic of tuberculosis (TB) and diabetes in Kiribati, including the alarming figure that 7 of the 10 countries with the highest prevalence of diabetes in the world are located in the Pacific.
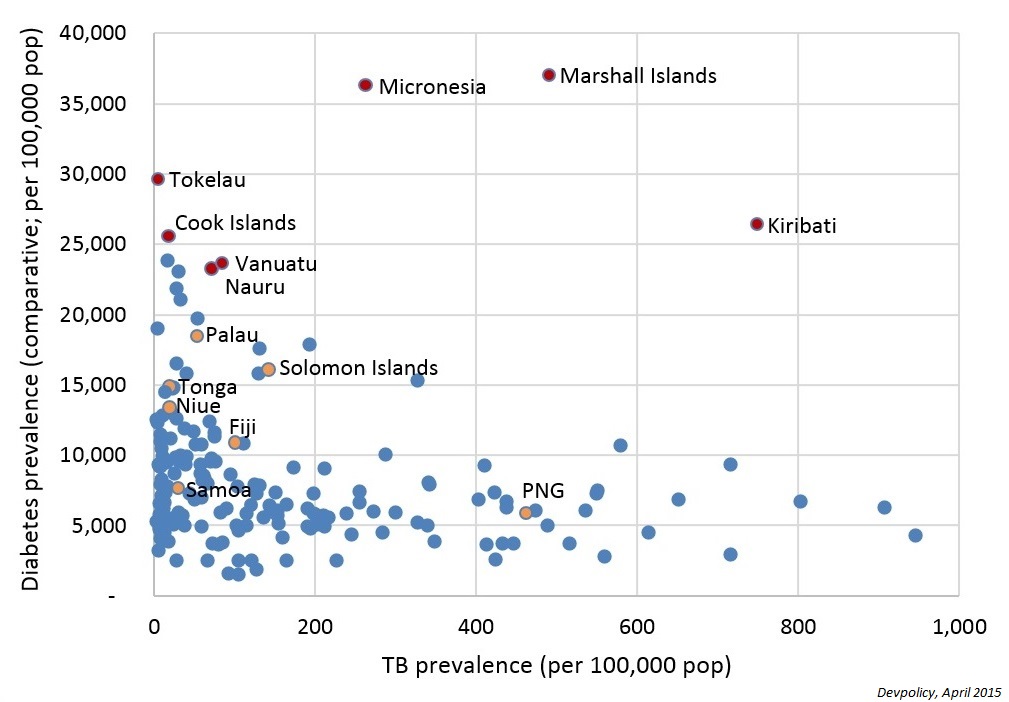
Just how far do Kiribati and other Pacific nations stand out from the crowd when it comes to TB and diabetes? When diabetes prevalence is plotted against TB prevalence for 195 countries (Figure 1), the severity of the TB-diabetes co-epidemic in the Pacific is immediately apparent.
The 7 countries that are in the top 10 for diabetes prevalence are highlighted in red; for comparison, other Pacific Island countries included in the dataset are indicated in orange.
Figure 1: TB and diabetes prevalence for 195 countries
A couple of important notes about this scatterplot:
- The dots represent the burden of disease at the national level – not the rates of co-morbidity within individuals, which is the primary focus of the research recently published by Kerri and her colleagues. However, these country-level trends fit with individual level data.
- Though (as Kerri noted in her blog) screening for TB and diabetes is on the rise in the Pacific and elsewhere, in this plot I have deliberately used prevalence rather than incidence (the number of new cases). Assuming the data is otherwise sound, this means that the scatterplot does not document a recent scale-up in diagnoses in the Pacific, but rather reflects the (estimated) burden of disease within the population – including among people who may not yet know they have diabetes and/or TB. If anything, this caveat makes these figures even more disturbing.
When the data is plotted on a log scale (Figure 2), we can see that globally there is a negative relationship between prevalence of TB (historically a disease of poverty) and diabetes (a disease of affluence). But this is not the case in the Pacific, where the three countries with the highest rates of diabetes in the world are among the four highest in the Pacific in terms of TB rates.
Based on these data, the double burden of communicable and non-communicable disease appears particularly acute in the Pacific; perhaps the most acute of any region in the world.
Figure 2: TB and diabetes prevalence for 195 countries (log scale)
Data notes:
TB prevalence data represent the midpoint estimate of TB prevalence per 100,000 population, taken from the WHO Global Health Observatory (2013 data). The sole exception is Tokelau; the most recent estimate of TB prevalence available from the WHO is from 1999 (as reported in the 2014 World TB Report [pdf]). Diabetes prevalence data are taken from the International Diabetes Federation (IDF) 2014 Diabetes Atlas [xls], and converted from percentage to prevalence per 100,000 population. In the scatterplot I have used the IDF’s estimates of comparative prevalence for diabetes, which adjusts for each country’s age structure.


Leave a Comment