Two previous posts in this series, the first here and the second here, explored the record 2014 Official Development Assistance (ODA) spending outcome by looking at aggregate outflows from the main sources, aggregate inflows to developing countries, and the distribution of aid to the main groupings of developing countries and organisations.
Among other things, the previous post showed that around one-third of all aid is neither contributed to multilateral organisations nor attributed to specific countries or regions, suggesting a shift toward thematic and transaction-based funding mechanisms. It also observed that aid specifically attributed to poor and fragile countries fell in 2014 after a spike in 2013, while remaining close to its five-year average, but disputed whether, as has been claimed, this can be taken as evidence of a worrying downward trend.
This final post in the series provides a broad examination of the ways in which aid was used in 2014, both in terms of broad sectoral classifications and in terms of channels and more specific purposes, with some discussion of trends over time. It then sums up the findings of the series.
Aid purposes and channels
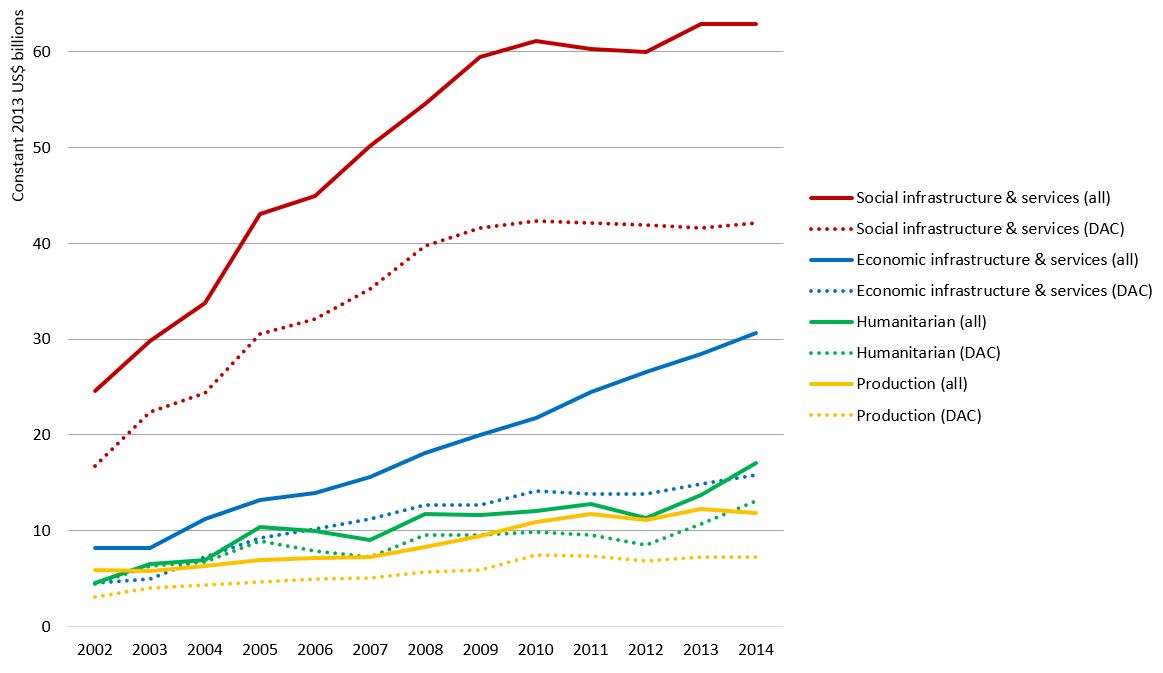
As can be seen in Figure 1, the level of aid for social infrastructure and services from all sources—the bilateral aid programs of the member countries of the OECD’s Development Assistance Committee (DAC) and other countries whose aid is measured by the OECD, together with the programs of multilateral organisations—grew very strongly in the period from 2002 to 2010, then more or less plateaued at around $62 billion per annum. Aid for economic infrastructure and services didn’t grow as strongly in the period 2002-10, but nor did it plateau after 2010. It kept growing at about the same rate, rising from $8 billion in 2002 to over $30 billion in 2014. As a result, aid for social infrastructure and services is now only about twice the size of aid for economic infrastructure and services, whereas in 2002 it was three times the size.
Figure 1: Aid by major sector

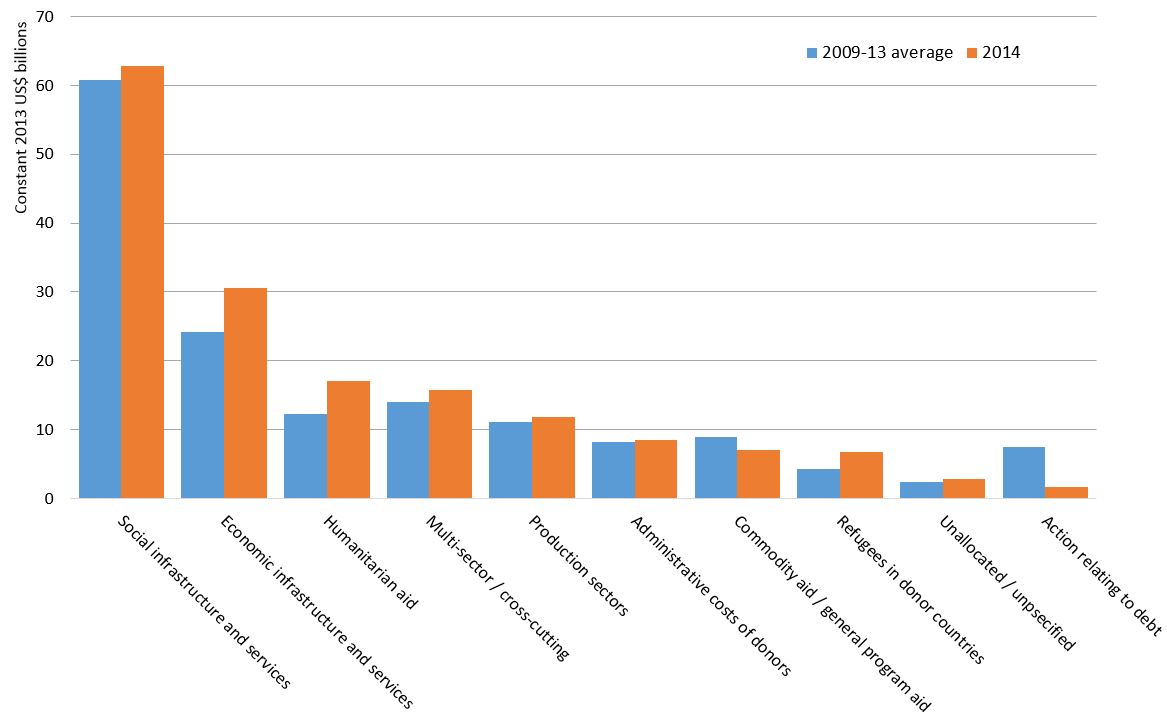
The most notable other recent shifts, aside from those relating to refugees in donor countries and debt relief (which are discussed further below), relate to humanitarian aid and to budget support from DAC countries. Humanitarian aid increased by 25% in 2014 to $17 billion, almost 40% higher than the average of the previous five years. General budget support, on the other hand, appears to be collapsing. The total level of such support fell by 62% to just $3.6 billion, which is 44% below the five-year average. The majority of this was from multilateral sources. General budget support from DAC donors fell by over 70% to only $1.1 billion, 60% below the five-year average. Sector budget support from all sources was more stable: despite a 14% drop to $5.9 billion, it remained 13% above the five-year average. Reflecting the fall in general budget support, the level of aid provided via ‘project-type interventions’ was 21% above its five-year average for all donors, and 12% above for DAC donors.
Figure 2: Aid by sector in 2014

Overall, changes in the allocation of aid to the main sectors in 2014 were quite substantial and, in the case of the social/economic balance, humanitarian aid and budget support appeared to accelerate medium-term trends. This is clearly illustrated in Figure 2, which compares 2014 flows from all sources to average flows over the previous five years.[1]
Contested flows
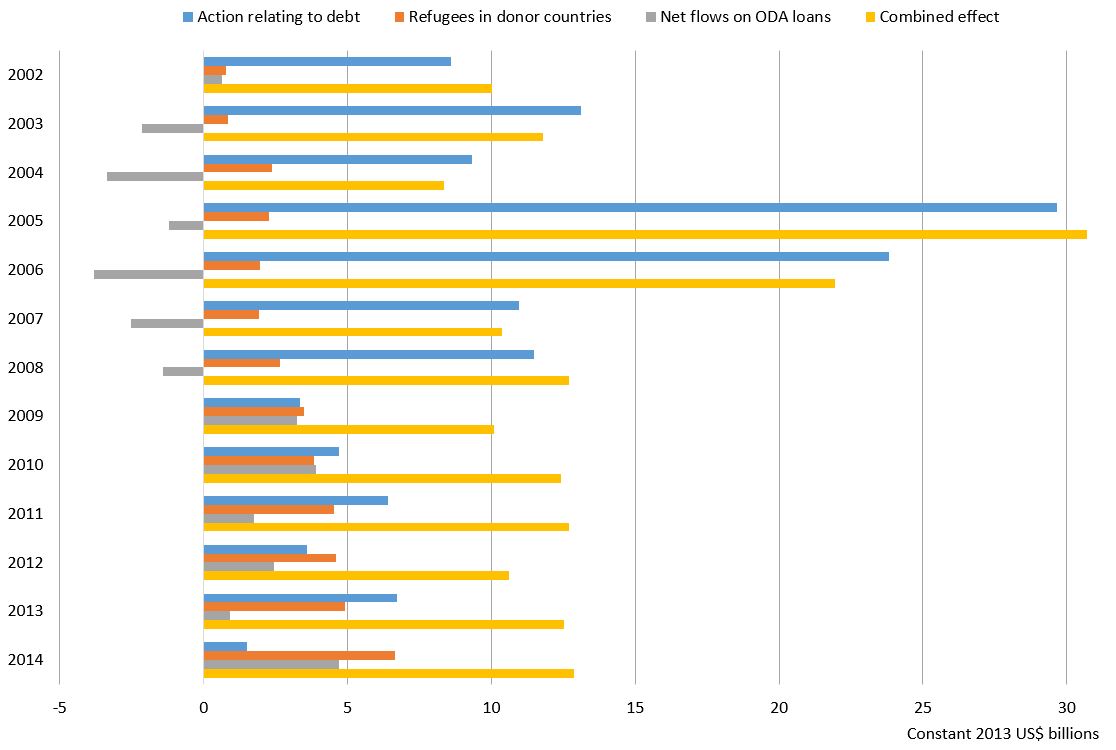
Various categories of ODA are contested in varying degrees, on the basis that they are not ‘real’ aid or are not correctly accounted for. Prominent among these are debt relief, concessional lending, and costs associated with refugees and asylum-seekers in donor countries. Net flows in these three categories since 2002 are shown in Figure 3, together with their collective net contribution to total ODA (yellow bar).
Figure 3: Contested DAC ODA flows

We can almost ignore debt relief in 2014, as it barely figured. Total debt relief was just $1.5 billion, 76% below the 2013 level and 70% below the five-year average.
While there is nothing inherently questionable about classifying concessional loans as ODA, provided they are genuinely [paywall] concessional, the current accounting treatment of these loans is such that surges in lending can look like surges in ODA, even though, in the long run, some of the flows counted will flow back to donors as repayments of principal and figure as negative ODA. New accounting arrangements have recently been agreed that will see only the present-day grant equivalent of such loans counted as ODA, but these arrangements will not take effect for some time yet. So, was the 2014 ODA outcome a result, at least in part, of increased concessional lending?
No, but also yes. The total level of DAC concessional lending moved up from $14–15 billion per annum in the 2009–12 period to $17.9 billion in 2013 and then increased a little more to $18.6 billion in 2014. The total volume of grants provided in 2014 was $2.2 billion less than in 2013. However, for unclear reasons, repayments on concessional loans fell by a very substantial amount, $3 billion, in 2014. A fall in repayments has the same effect on the bottom line as an increase in disbursements, so the net impact of the several factors just mentioned was a $1.6 billion increase in total DAC ODA disbursements. Almost no ground was gained by increasing lending in 2014, but the lucky fall in repayments meant that donors’ loan portfolios did do them a modest favour.
The counting of onshore refugee and asylum-seeker costs as ODA is regarded by many people as highly questionable. This is in fact debatable, but there are certainly valid questions about the rules that should be applied in determining the eligibility of specific costs. At present, the relevant rules are vague and interpreted variously.[2] The amount of expenditure reported in this category has risen substantially in recent years. For some individual DAC donors, the increases have been quite dramatic. Most notably, Italy and Greece reported increases of 58% and 46%, respectively, in 2014. For Sweden and the Netherlands, the increases were 25% and 22%, respectively. However, overall, only around 6% of DAC donors’ ODA is spent on onshore refugee costs. The increase on this reporting line in 2014 was $1.8 billion, almost the same as the overall increase in DAC ODA. In other words, all else being equal, DAC aid would have approximately maintained its 2013 level, which was a record up to that time, even without any additional spending on onshore refugee costs.
More generally, the combined net contribution made by these several types of contested flow to the total level of DAC ODA has been quite stable over recent years, at around $12.5 billion, and there was no significant increase from 2013 to 2014.
Summary of findings
As these three posts have shown, the record global ODA spending outcome in 2014 was a solid achievement for OECD countries, not much assisted by the inclusion of contested flows. While the 1.2% real increase to $136.5 billion owed something to increased spending on onshore refugee costs and a decrease in loan repayments, the impact of these factors was almost entirely offset by reduced claims for action relating to debt.
It is striking that half of OECD aid is now provided by just three leading donors: the United States, the United Kingdom and Germany. The 56% increase in measured non-DAC bilateral aid in 2014 was also remarkable, but future falls could easily be as large given past volatility, especially in aid from Saudi Arabia. Future movements in the volume of aid, from both DAC and non-DAC sources, are at present impossible to predict with anything approaching precision. However, it is hard to imagine that reductions in aid from DAC sources would exceed increases in aid from non-DAC bilateral sources during the next few years. The total volume of concessional finance available to developing countries is therefore likely to remain stable or grow.
There seems to be a definite trend, which accelerated in 2014, toward increased expenditure on economic infrastructure and services, combined with a flattening, though not a reduction, of the much larger expenditure on social infrastructure and services. More aid is being provided in project form, and almost none as general budget support. Humanitarian aid is rising as a share of aid, and now accounts for around 11% of all aid.
Aid specifically attributed to poor countries fell in 2014, owing in part to reduced debt relief for Myanmar, but remained close to five-year averages. At least part of the fall reflects another long-term trend: aid seems to be becoming less country focused, and more often allocated to geographically unrestricted (non-multilateral) funding mechanisms that support specific projects or transactions. Multilateral aid grew modestly overall, but contributions to ‘vertical’ funds continued to rise steeply. Contributions to UN agencies, which have barely increased in thirty years, continued to stagnate.
In sum, the news about aid in 2014 is genuinely good news, and the short- to medium-term outlook for aid volume is reasonably promising. However, too little is known about the uses and the quality of aid from most non-DAC bilateral sources. Only the United Arab Emirates reports its aid to the OECD at activity level. It is perhaps time for the OECD to begin placing much greater emphasis on the recipient-country perspective in the way it presents global aid flows, and to intensify its efforts to understand the nature of non-DAC bilateral aid. It is becoming increasingly anachronistic that the OECD announces each year an aid total that is not in fact a global aid total.
Robin Davies is the Associate Director of the Development Policy Centre.
This three-part blog series (part one here and part two here) has been compiled into a policy brief titled “Aid’s new contours: an exploration of global aid flows in 2014“.
[1] Budget support is included under ‘general program aid’.
[2] Rules relating to the ODA-eligibility of onshore expenditure on refugees and asylum-seekers are stated in paragraphs 73 and 74 of the DAC Statistical Reporting Directives.


Leave a Comment