
Australian aid NGOs’ revenue fell from 2015 to 2017 (you can see the fall in this chart). Much of this fall stemmed from a drop in donations.
You can see the drop in donations in the chart below. It’s not a collapse, but donations have fallen two years in a row, which is unusual.
Total aid NGO donations – Devpolicy time series
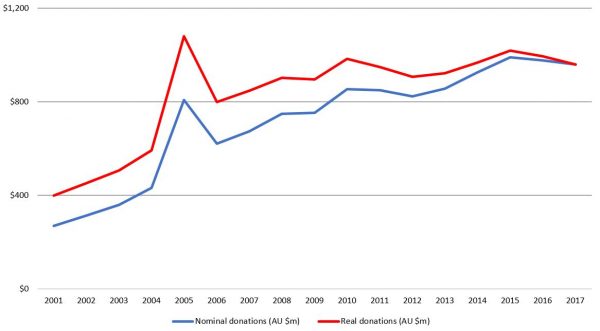
This chart is based on Devpolicy’s NGO revenue dataset. You can download the chart from Devpolicy’s Aid Tracker. (Scroll to the bottom of this page).
The dataset includes all ACFID members as well as the two largest NGOs not part of ACFID. (Although it’s our dataset, we maintain it using data from ACFID member surveys. We’re very grateful to ACFID members for their transparency, and to ACFID for surveying them. In many countries, equivalent data don’t exist.)
Tracking NGO revenue and donations over time isn’t easy. Not all NGOs report every year. And some NGOs have to make judgement calls as they report — deciding how to separate donations for domestic work from donations for international work, for example. One explanation for the fall might simply be that some NGOs forgot to report or changed what they reported. But when I excluded all problematic NGOs from my analysis, I found the same trend.
Another problem analysing NGO revenue trends is that the Australian NGO community is — in an arithmetic sense — a strange one. A few NGOs are much larger than everyone else. Because they’re so large, big NGOs can play an out-sized role in driving aggregate trends. As a result it’s always possible the recent drop stems from nothing more than grim times at a couple of the big NGOs.
The next two charts below test this. Both charts are limited to those ACFID members that provided data in 2015, 2016 & 2017. The first chart is a histogram that groups NGOs based on how much their public donations rose or fell (after adjusting for inflation) from 2015 to 2017. The x-axis shows the percentage change in volume of donations between 2015 and 2017. The y-axis shows how many NGOs had revenue changes of the magnitude indicated on the x-axis.
The chart shows the varying fortunes of NGOs. Some saw donations collapse to almost nothing, while others went through the roof. Others occupy almost all points in between. (Ten small NGOs with revenue rises of greater than 100% are excluded from the chart for legibility’s sake. Big changes are usually among small NGOs; if you’re tiny it doesn’t take much to change revenue a lot in percentage terms.)
Histogram of NGO donation revenue change 2015-2017
 And yet, while there’s a lot of diversity, as the next chart shows, donation revenue fell from 2015 to 2017 for most NGOs. Australian aid NGOs are a diverse group. But the bulk of them still had a hard time of it.
NGO donation revenue change 2015-2017 — going up compared to going down
 Why have donations fallen for most NGOs?
One obvious explanation is the state of the economy. If people are feeling the pinch they may be less inclined to give. The next chart compares Australian GDP/capita growth rates for each year (from the World Development Indicators) and the year-on-year percentage growth in donations to Australian NGOs.
GDP growth versus change in donation volumes to Australian aid NGOs
 There’s a clear correlation (if you’re curious, the p-value in a simple bivariate OLS regression is 0.05). On average, in years when the economy grew more rapidly, donations to NGOs grew more rapidly too. Growth was particularly low in 2017. It wasn’t great in 2016 either. This likely explains much of the fall.
The economy’s not the end of the story though. If you look closely, you’ll see I’ve excluded the two years around the Indian Ocean Tsunami from the chart — donations surged and then fell around this event in a manner that had nothing to do with the state of the economy.
Also, donations in 2017 and 2016 were still less than we’d expect from the average overall relationship between economic performance and donations (shown by the line of best fit). Something else is going on.
I thought one explanation might be that donations to humanitarian emergencies had fallen. As best I can tell, however, by inferring from NGO project-level expenditure data, this hasn’t been the case. (Once again using data from ACFID NGOs that reported in all years). As revenue has fallen, Australian NGOs’ spending on humanitarian work globally has fallen with it, but not nearly as much as spending on other work. Globally, if spending patterns are anything to go by, the Australian NGO community sees about as much need for humanitarian work as ever. Given ongoing crises in Syria and Myanmar, I can understand why.
But, on the other hand, spending on humanitarian emergencies has fallen a lot in the Pacific. This makes sense. 2015 was Cyclone Pam. 2016 brought Cyclone Winston. Droughts afflicted parts of PNG over the same period. 2017 was less disastrous. You can see this reflected in NGO spending in the next chart.
NGO project spending in Pacific (nominal million AUD)
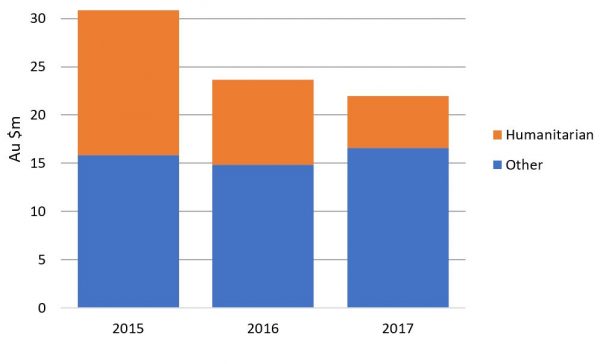
The chart on its own is hardly definitive, it’s spending, not actual donations, for a start, and NGOs have some discretion over spending patterns. But data from EM-DAT, the Emergency Events Database also show a fall in major natural disasters in the Pacific over the same period.
These facts suggest an additional explanation for the fall in donations to Australian NGOs in the last two years: fewer high-profile disasters close to home. If correct, this would be a happy explanation for the Pacific at least. But given ongoing global problems, the fall in donations is still far from good news. It would be better if quiet times in the Pacific meant more donations made to other countries in need, rather than fewer donations in total.

Beyond the Pacific but still in the neighbourhood, the 2015 Nepal earthquakes would have driven a significant bump in donations for a few agencies in that year. Which weren’t really matched by the Rohingya crisis in 2017.
Hi Terence.
Thanks for the article, interesting analysis.
Quite a while ago, when I was working at Red Cross, we noted the growth surge in donations following major disasters. Maybe something to do with the positive publicity and profile about successful aid projects which rebuild communities following major humamitarian events. That publicity would continue for months and years after the initial event.
Another more general factor maybe that we are now living in a different political climate – where donor governments around the world have slowly turned down the funding tap.
Deliberately, international assistance is no longer widely promoted as good humane policy. Foreign assistance has been relegated and diminished and rebranded as part of security and trade impact.
And there are more and louder political voices now arguing that “outsiders” are a threat to our way of life..as per the immigration debate.
Unsurprising that in this climate, community donations would tend to be more vulnerable.