Has the PNG economy been in recession?
By Nelson Atip Nema and Stephen Howes
22 December 2016
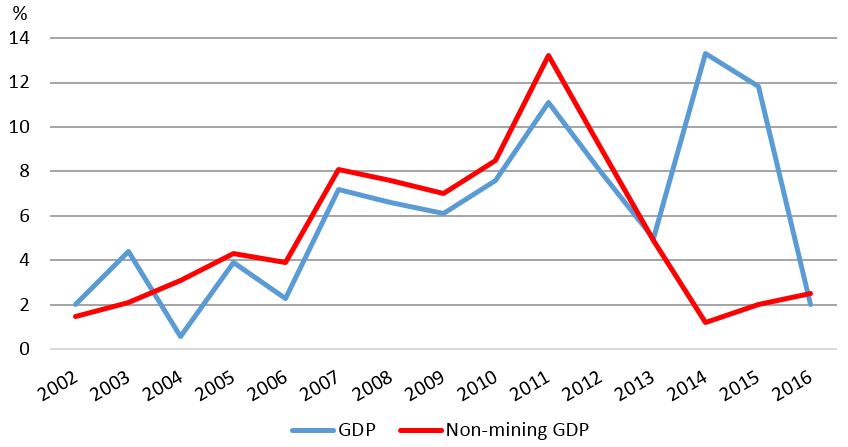
The most recent official data shows positive though low economic growth in Papua New Guinea. For a highly resource-dependent economy such as PNG, non-mining (or non-resource) GDP – which excludes oil, gas and mineral production – is a better welfare indicator than GDP itself. As Figure 1 shows, non-mining GDP has been on a declining trajectory since 2011. GDP growth recovered in 2014 and 2015 due to LNG exports, but it has also since slowed. The most recent Treasury estimates (in the 2017 budget) for GDP and non-mining GDP growth are 2% and 2.5% respectively.
Figure 1: GDP and non-mining GDP growth
Source: PNG Treasury
Growth has slowed, but is it still positive? A recession can be defined more flexibly but is normally defined as two quarters of negative growth. GDP estimates are produced by Treasury rather than the National Statistical Office (latest NSO GDP data is for 2013) and quarterly GDP data are not available. In this post we look at other data. We focus on indicators most relevant to non-mining GDP because of its greater relevance for PNG. For example, we look at imports rather than exports since exports are largely of resources.
Formal sector employment growth was strong until 2013, but was stagnant in 2014, and negative thereafter (Figure 2). The decline from the peak in employment in 2014 to its level now is about 3.5%. Encouragingly though, the most recent numbers do show a modest pick-up in formal-sector employment in 2016.
Figure 2: Formal employment

Notes: BPNG data; March 2002=100.
We can also examine imports (Figure 3). Imports roughly halved between 2013 and 2015 and preliminary data for the first six months of 2016 indicate a continuing sharp fall. Some of this would be due to lower commodity prices (e.g. for oil imports) but part is likely to be an indication of reduced demand. Imports in 2015 were back at below 2006 levels. One reason for the sharp decline is the rationing of foreign currency. The economy would not have contracted by as much as imports, but nevertheless reduced imports are strongly suggestive of reduced demand and domestic output.
Figure 3: Imports

Notes: BPNG data; imports are of goods and services; 2016 figures are annualized based on first quarter only.
Tax data can also be used to examine economic trends. We exclude mineral and petroleum taxes to focus on economy-wide taxes such as corporate tax, income tax and GST. Figure 4 shows a decline of 4% in 2015 and 6% in 2016 – and that’s before inflation. The decline after inflation over the two years in economy-wide taxes is in excess of 20%. Probably the LNG project paid above average taxes during its construction phase due to high compliance, but even so it is hard to explain the ongoing fall in economy-wide taxes without assuming a contracting non-resource economy.
Figure 4: Economy-wide taxes

Note: From 2017 budget; total tax revenue minus mineral and petroleum taxes
Finally, there are the views of business. In an interview with Business Advantage PNG, Bismark Maritime CEO Jamie Sharp stated that “Between this year and last year there has been about a 25 per cent drop in freight.” Sharp indicated that a lot of his customers said that they were “experiencing that kind of drop in sales.” He suggested that coastal shipping was a “barometer” for the economy, and noted more positively that “the fall in volumes is coming to an end.”
None of these data sources are perfect. Only a small fraction of the PNG workforce is in formal employment; and import data is affected by foreign exchange rationing. Still, put together, and especially bearing in mind the large decline in tax revenue even excluding resource taxes (20% after inflation), it is hard to believe that the non-resource economy has not been contracting in 2015 and 2016. Certainly GDP grew in 2015 thanks to strong LNG export growth. But it should not surprise us if the end of the LNG construction phase and the fall in commodity prices led to a contraction in the non-resource economy. Employment, imports, tax revenue and qualitative evidence all seem to point in this direction.
Some analysis has addressed some of this evidence, but the multilateral organisations responsible for monitoring the PNG economy such as the Asian Development Bank and the World Bank continue to rely on official government GDP estimates. It will be interesting to see what the IMF has to say in its annual (Article IV) report on PNG, which is expected soon.
If we take this data seriously, we can only conclude that the government should utilize macroeconomic tools and implement microeconomic reforms to stimulate the economy and put it back on a growth path.
Nelson Atip Nema is a Lecturer in Economics at the University of Papua New Guinea. Stephen Howes is Director of the Development Policy Centre.
Note: Figure 1 was replaced by a slightly modified, corrected version on 18 April 2017.
About the author/s
Nelson Atip Nema
Nelson Atip Nema is a Lecturer in Economics at the University of Papua New Guinea.
Stephen Howes
Stephen Howes is Director of the Development Policy Centre and Professor of Economics at the Crawford School of Public Policy at The Australian National University.
