

The Development Policy Blog on donations to international development NGOs since 2000 has prompted me look at whether this trend is part of the cyclical nature of support for NGOs or does it represent a more fundamental change in the public support for development NGOs? Of course making sensible comparisons over long periods of time is difficult, but one way of doing it is to look and donations to NGOs as a proportion of GNI, which adjusts income to the size of the economy at the time.
The other issue is accessing reliable data. ACFID only started publicising this data from 1983, and rather frustratingly not every year since, and a separate overseas aid fund was only required for development NGOs post-1981 as part of Deductable Gift Recipient (DGR) status. Prior to that time the data is patchy, and based on NGO expenditure rather than fundraising. Nancy Anderson collected data from the twenty NGOs major NGOs during the NGO workshop convened by Sir John Crawford at the ANU in March 1964 as part of the first tentative steps to establishing ACFID. She found that they sent £3m ($A6m) or 0.031% GNI overseas in 1963[1]; which she admits was an understatement, given that not all NGOs were present. Of interest the Freedom From Hunger Campaign Appeal the first large scale fundraising campaign for development NGOs accounted for one third of that figure, representing a major boost in fundraising at the time. By 1965 the amount sent by NGOs had, according to ACFOA, risen to $7m or 0.03% of GNI. If we assume a fundraising and administration costs of ~10-15% then a ratio of around 0.035% of GNI was raised by Development NGO in the mid-1960s.
The next source of data from Lissner (1977) who looked at cross-national spending by donor NGOs based on DAC data from 1968-1973 and adjusted for exchange rates at the time. If we again assume administration and fundraising in the order of 10-15%, then peaks of greater 0.05% of GNI would be in 1968 and 1974.
Table 1: NGO aid/GNI 1960s
 These may have been a result of the Biafran crisis (1968) and the first Ethiopian Famine (1974) prompting major appeals.
For the 1980s the data is patchy with only three years of data available from ACFOA (now ACFID) Annual Reports for the following year.
Table 2: NGO aid/GNI 1980s
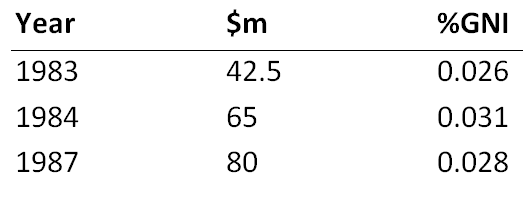 These years generally show a lower level of giving compared to the late 1960s and early 1970s, which was off-set by a sharp rise in government funding to NGOs through the 1980s, reaching a peak of 30% of NGO income in the early 1990s.There is a more complete set of data for the 1990s showing a steady increase in public donations to NGOs.
 Putting all of these data sources together we can paint a picture of the growth in development NGOs, and public support for them, over the past half-century.
Figure 1: Australian INGO aid/GNI over time
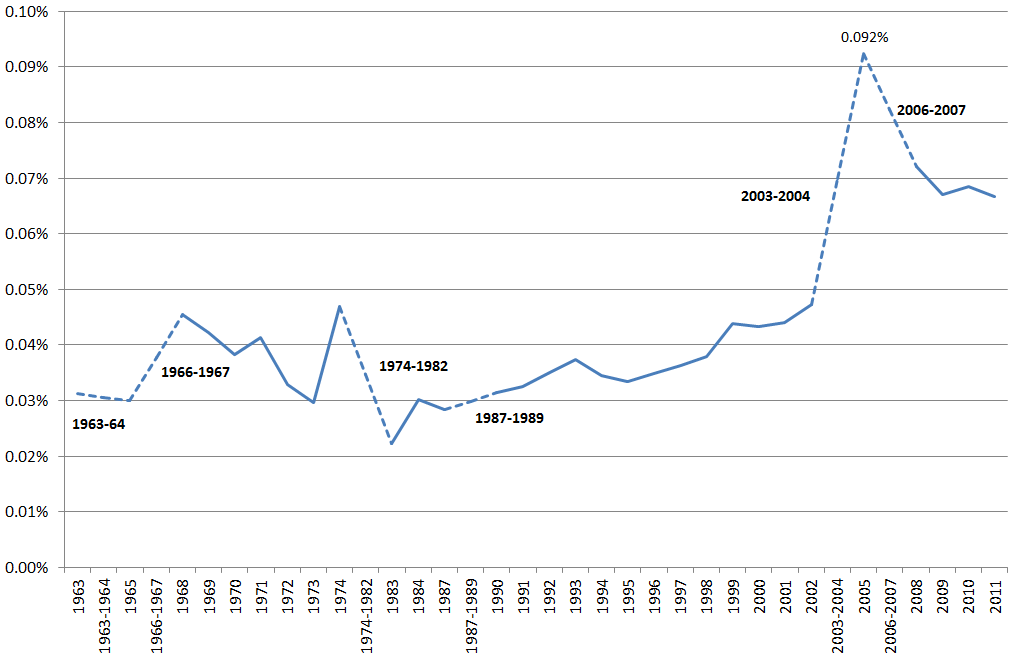 Dashes in the line graph indicate gaps in the dataset (listed in bold).
Dataset available here [.xlsx].
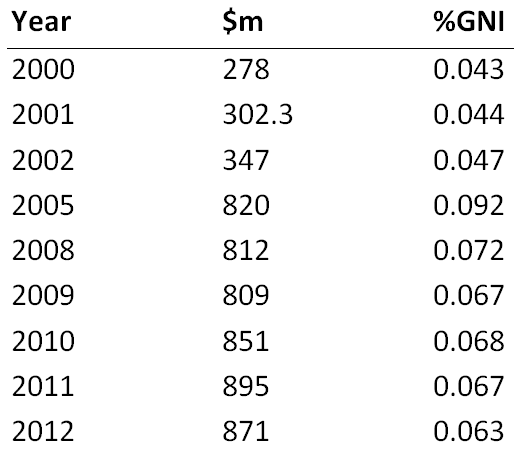
The interesting finding, which is different from the 1970s, in that after the spike due to the Indian Ocean Tsunami, the fall to the pre-tsunami of around 0.04% of GDP is not occurring as fast as before, and there may be longer term level of donations at a level greater than 0.05% of GNI. Some reasons for this may be better engagement with donors after a disaster. In the same way the Freedom From Hunger Campaign of the early 1960s kick-started NGO work in the late 1960s and early 1970s, the massive response to the Indian Ocean Tsunami may have reinvigorated the public response to development work.
Dr Patrick Kilby is a lecturer in Development Studies at ANU.
[1] This is based on the Piketty-Zucman Wealth-Income Data Set. 1960-2011. For 2012 an estimate was made based on the 2012 annual growth rate.

Leave a Comment