This Australian aid budget was meant to be a dull affair. Earlier rumours of large cuts had been denied. The expectation was for the status quo to prevail.
The first indication that things might be more exciting than expected came just before the budget when the annual “green book” (DFAT’s dataset of historical aid information) was released. This showed retrospective increases of $160-200 million in aid, in 2015-16 and 2016-17. Then on budget night the figures for 2017-18, 2018-19 and 2019-20 were all adjusted upwards by a similar amount.
Australian aid: the good news
The opportunity to put a positive spin on five increases in aid (at least relative to earlier estimates and projections) was, however, foregone by the fact that 2020-21 was as per earlier expectations, and 2021-22 below.
Australian aid: the bad

Most focused on the bad news but some highlighted the good. This post complements our initial commentary. It explains the good and the bad of the 2018 Australian aid budget, and assesses the balance.
The reason for the increases was that Australia’s capital contribution to the Asian Infrastructure Investment Bank ($930 million over five years starting several years ago) was, for the first time, regarded as eligible to be counted as aid (ODA-eligible, in the jargon).
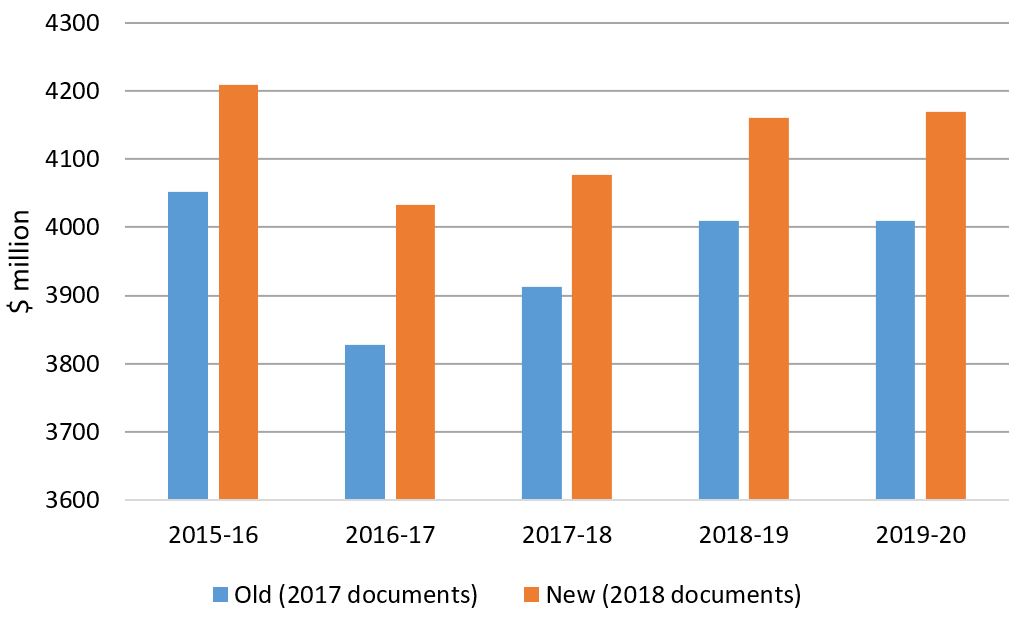
We had long argued that the AIIB capital subscription would be ruled ODA-eligible by the OECD Development Assistance Committee (DAC), the rule-making body on such matters. It duly did, though (for reasons that are unclear) it decided that 85% of such contributions rather than 100% would be ODA-eligible. DFAT had declined to act in advance of the DAC ruling. A beneficial consequence of this is that, once the contributions were ruled ODA-eligible, they had to come in on top of the aid program, at least for the three years already gone by. That precedent was then abided by for the remaining two years of payments. In the first graph, the gaps between the bigger and smaller bars totals $900 million, which is just slightly more than 85% of $935 million.
Once the AIIB payments were completed, however, the ODA figures were returned (in 2020-21) to their earlier trajectory. And then – though no reason was provided for this – ODA was once again in the new, outer-most year of the forward estimates (2021-22) frozen rather than, as per earlier commitments, increased in line with inflation.
In the scheme of things, these slight changes to the downward trajectory of Australian ODA hardly matter. They still add up to a cut in real terms of about one-third, by a government that came to power in 2013 promising at least to protect the aid program in real terms.
And it certainly could have been worse: AIIB funding could have been taken out of the aid program, rather than added on top.
But any sense that this was a good budget for aid was taken away by the continuation of aid cuts for yet another year. In fact, with one more cut, and the AIIB additions providing some slight flattening of the downward trajectory in the intervening years, the most recent numbers show that (after inflation and including this year), aid has now been cut five times in a row (as the ABC Fact Checker has now confirmed) and it’s due to be cut for another three.
Australian aid: now eight cuts in a row
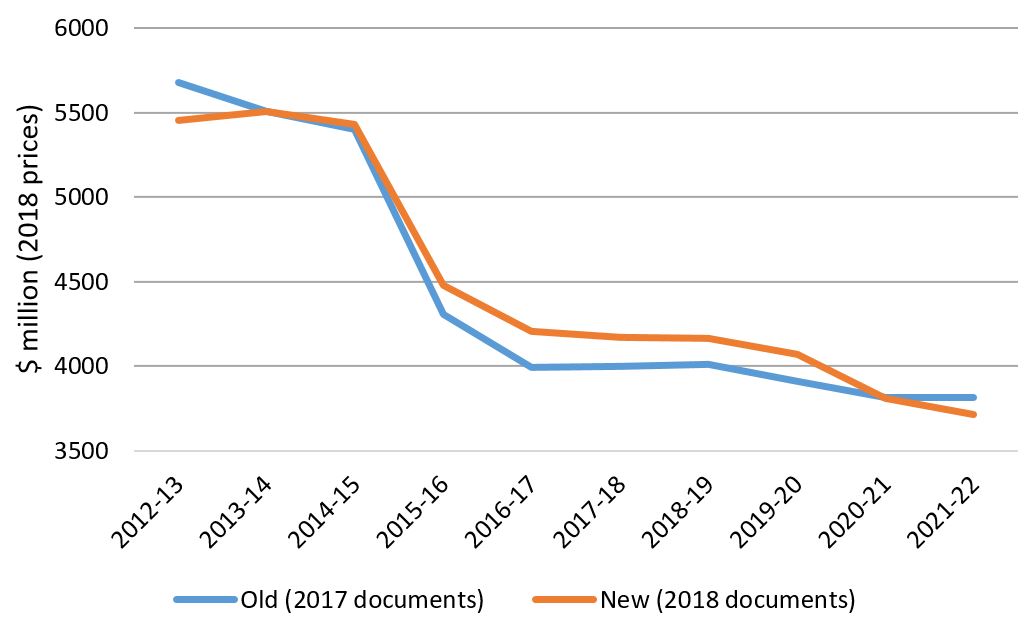
The graph below summarises the damage done to the aid program to successive budgets. The red dot is the last Labor aid budget, for 2013-14. The lines show the figures released in successive budgets by the Coalition, including forward estimates (projected outwards to 2021-22), as well as the revisions to past years just released. In 2014, the Coalition said it would cut aid but only for that year. In 2015, it cut aid savagely over the next two years. In 2016, the Coalition said this cut would be the last. In 2017, it foreshadowed further cuts in 2019 and 2020. This time round, in 2018, there are only cuts to be seen, in all directions.
Aid budgets from 2013-14 onwards

The worst feature of the 2018 budget, one that to my mind more than offsets the AIIB boost, is that it keeps aid on a downward trajectory. Buried in the budget documentation (p. 57) is a commitment to recommence aid indexation in 2022-23, but it is hard to give this much credibility after the last two years of cuts to the outer years of the forward estimates. It seems that this has become the new and politically-even-more-painless way to reduce aid spending. This time round, the Foreign Minister didn’t even feel compelled to justify the latest raid on the aid program. Is aid now on a permanent downward trajectory? How low will it go?
Notes: No 2021-22 forward estimate is provided in the 2017-18 budget, but the policy position was that aid would be increased with inflation. This is reflected in the second and fourth graphs above. The fourth graph also has aid in all years beyond the forward estimates of the relevant budget indexed to inflation, in line with government policy. Another change in the 2018 “green book” is that the 2012-13 figure was revised down. So the first year of Coalition aid cuts, relative to actuals, now comes in 2014-15 rather than, as earlier believed, 2013-14. You can see our latest aid figures in this spreadsheet.