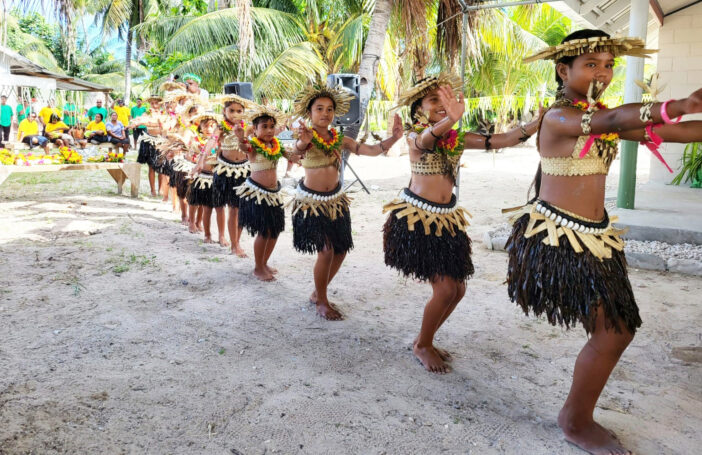
With 110,136 people spread across 33 atolls and 3.5 million square kilometres of ocean, Kiribati faces significant economic and service delivery challenges. In addition to being one of the most vulnerable countries in the world, and one most affected by climate change, other challenges stem from a highly dispersed population, remoteness to major markets, lack of arable land, a narrow economic base, and the dual problems of sparse outer island communities and heavy overcrowding in the capital.
This blog series looks at the challenges facing Pacific island countries graduating from least developed country (LDC) status, focusing on Kiribati, whose graduation is currently under review. This blog focuses on Kiribati’s economic structure, an understanding of which is essential to appreciate the likely impact of LDC graduation.
Let us compare the economic structure of Kiribati with other Pacific and small island developing countries: Samoa and the Maldives (which have already graduated), and Vanuatu (which is facing graduation in 2020). Presented below is the economic structure of each country just prior to LDC graduation.
Figure 1: Small island LDCs – contributions to GDP in the year prior to LDC graduation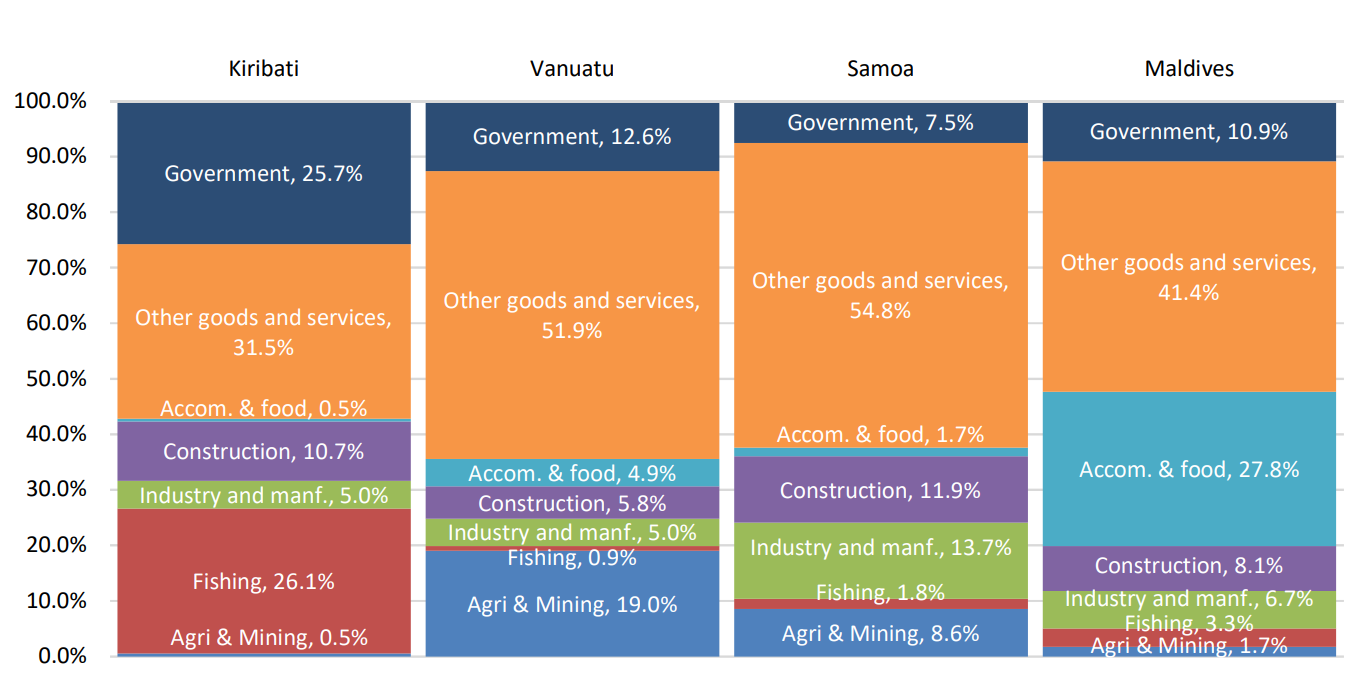
Source: UNESCAP
As shown above, the economic structure of Kiribati differs markedly from the other three countries. Most striking is the reliance on fishing, which accounts for 26.1 per cent of the Kiribati economy, compared to an average of 2.0 per cent across the other three. There is also a much heavier reliance on government consumption (25.7 per cent in Kiribati versus an average of 10.3 per cent for the others).
Among its three peers, the retail and services sectors made up the majority of the economy even prior to graduation from LDC status, and was also the major source of growth. In contrast, between 2011 and 2016, Kiribati grew an average 6.2 per cent per annum, with most of this coming from fisheries (26.2 per cent), government consumption (21.1 per cent), and construction (20.7 per cent) – the latter two being funded through increases in fisheries revenue and donor programs. Across a similar period:
- The Vanuatu economy grew 1.8 per cent per annum, driven by construction (27.5 per cent), retail goods and services (26.3 per cent) and government consumption (19.4 per cent).
- The Samoan economy grew 2.8 per cent per annum, driven by general commerce (46.0 per cent), personal and other services (18.6 per cent) and transport (13.9 per cent).
- The Maldives economy grew by 3.4 per cent per annum, driven by tourism and related industries (35.5 per cent), communications (21.1 per cent), and construction (17.6 per cent).
The case of Vanuatu shares some common elements with Kiribati in relation to public spending and construction, but none of the other three substantively changed the value they extracted from their fisheries resources (except for a small rise in Samoa in 2017/18, well after Samoa had graduated from LDC status), nor did any country advance through widespread industrialisation (the ‘typical’ development path). It is also notable that none of the other three countries have a scheme similar in economic size to Kiribati’s copra subsidy scheme, which accounted for 9.3 per cent of GDP in 2016, is given directly to copra growers, and contributes to an industry worth only 0.5 per cent of GDP.
From this perspective, it is clear that the economic and development policies that would be appropriate for Kiribati will not necessarily match those of its peers.
Most importantly, the role of the public sector in Kiribati is likely to be a much more important driver, given its share of GDP. Indeed, the story of recent economic growth in Kiribati is intrinsically tied to the ability of the government to increase its spending, with an almost complete dependence on public spending to support economic activity. This expanded fiscal capacity has been supported by buoyant fishing license revenues. In particular, the increase in the value of a purse seine fishing day license from US$1,350 in 2011 to US$8,000 in 2016 dramatically increased the financial capacity of the government to finance a much-expanded budget, and rapidly increased Kiribati’s GDP. In terms of total revenue, fishing licence revenue in 2011 was just US$29.1 million (17 per cent of GDP), but by 2015 revenue had risen to an estimated US$197.8 million (88 per cent of GDP) and has remained at historically high levels in subsequent years.
Figure 2: Fishing license revenue in Kiribati 2011-2017

This rapid expansion in fisheries revenue had a material impact on the fiscal position of the government, with large surpluses accumulating over 2014 and 2015 (see Figure 3). These surpluses contributed to a significant improvement in the government’s cash position, and allowed the government to make notable contributions to the Kiribati Sovereign Wealth Fund (the Revenue Reserve Equalisation Fund, or RERF): non-RERF cash balances increased from US$20.4 million in January 2016 to an estimated US$173.5 million by the end of 2018, and the RERF balance grew from US$679.0 million in 2014 to an estimated US$994.4 million by the end of 2018 (due in part to a US$50 million deposit in 2015 and a US$70 million deposit in 2016). However, between 2015 and 2018 we can also see a sustained increase in government expenditure; initial increases were in capital expenditure, with later years also showing an increase in operational spending. With no revenue increases since the peak of 2015, this additional expenditure served to significantly reduce the budget balance.
Figure 4: Kiribati fiscal position 2011-2018
This growth in fisheries revenue is likely to plateau as price increases for purse seining days cannot continue in perpetuity and the number of fishing days allowable within the Kiribati EEZ needs to stay within sustainable limits in order to maintain viability of the fishery. This essentially means that, subject to fish spawning and migration patterns, the amount of rent that the Kiribati government can extract from the fisheries resource is capped by the willingness of distant water fishing fleets to pay for higher prices on tuna fishing days, the sustainability of the stock, and the limited capacity of Kiribati to derive onshore (processing) benefits from its fish stock.
So if there are limits to the rents that can be extracted from fisheries resources, where will the future economic growth for Kiribati come from? What strategies can Kiribati adopt to continue its development trajectory? Will graduating from LDC status make this more difficult?
Stay tuned.