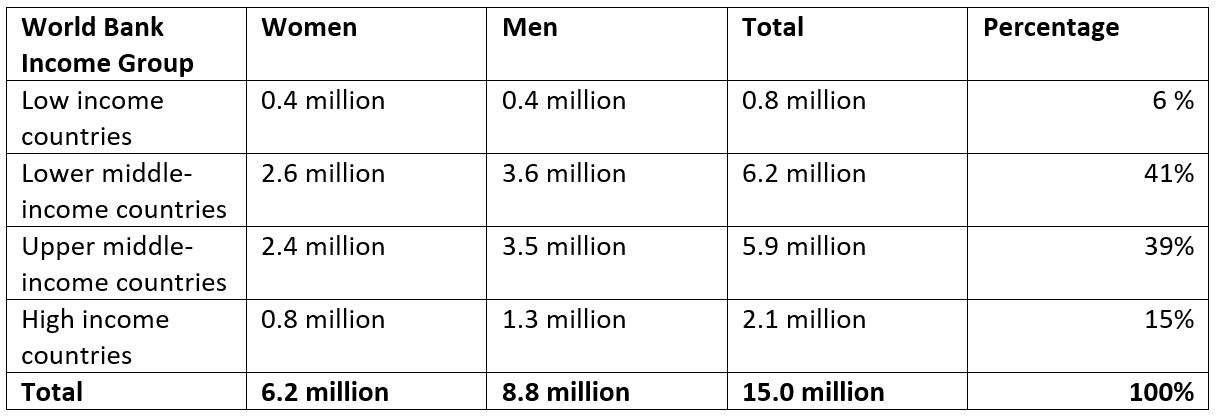
The World Health Organization (WHO) has recently released documents about the four main non-communicable diseases (NCDs) – cardiovascular disease, diabetes, cancers and chronic respiratory diseases – that kill or disable people prematurely (between 30 and 70 years of age). One WHO report, Why is 2018 a strategically important year for NCDs?, provides estimates of NCD premature deaths globally. As can be seen in Table 1 below, WHO estimates that there were 15 million premature deaths from NCDs in 2015. This is significantly more than the 12 million deaths from communicable and perinatal diseases. Importantly from a development perspective, 80% of premature NCD deaths occur in middle-income countries, with most premature deaths (41% of the global total) occurring in lower middle-income countries. WHO states that while the risk of premature deaths from NCDs has been falling in all income groups, the decline was much larger in high-income countries, thereby increasing the gap with low and middle-income countries.
Table 1: Premature deaths in 30 – 70 year olds in 2015
Measuring the policy responses to reduce the burden of NCDs
Reducing premature deaths and disability is important because they impose large financial, economic and social costs on households and government budgets, and many NCDs are often preventable – or at least can be postponed – through reductions in risk factors. Sustainable Development Goal 3.4 aims to reduce premature death by one third by 2030. The 2011 United Nations High-level Meeting on NCDs agreed on a set of “best buys” and other interventions that countries could adopt to prevent and control NCDs. Another recent WHO report, Noncommunicable Diseases Progress Monitor 2017, assesses progress at the country level. In essence, the assessment tracks 19 specific indicators, summarised below:
- Set national targets: this involves three specific indicators, e.g. that member states have a survey for NCD risk factors every five years.
- Develop national multi-sectoral policies and plans (one indicator).
- Actions to reduce risk factors: 13 indicators to reduce tobacco use, harmful use of alcohol, unhealthy diets, and physical inactivity.
- Strengthen health systems: two indicators to strengthen management of NCDs, particularly through a primary care approach.
How well are countries in Asia and the Pacific doing?
Global scorecards should be viewed with some caution, especially as they are invariably dated (these refer to 2015) and, as with the latest WHO monitoring, involve self-reporting. But they do provide some broad guidance.
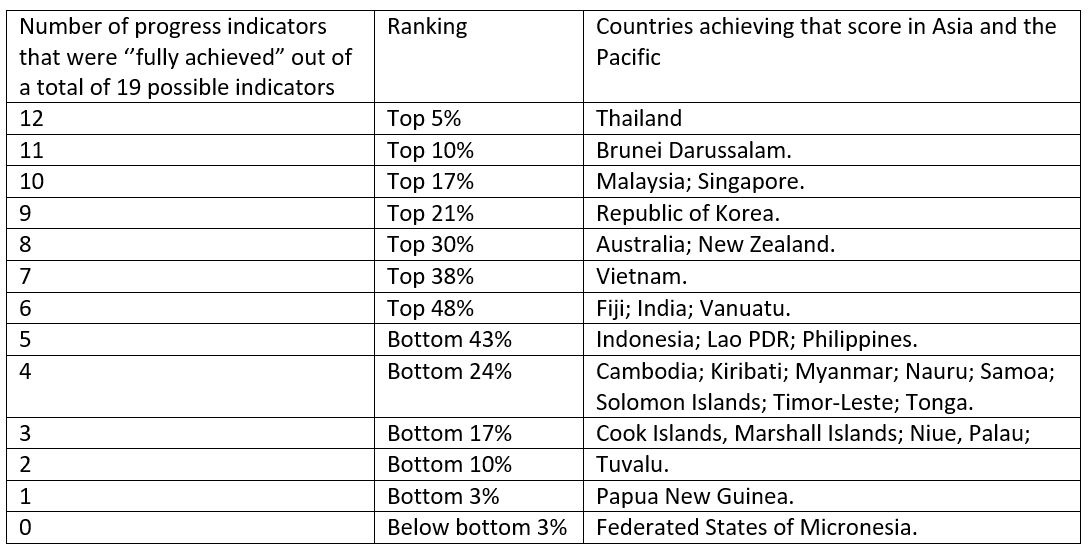
The WHO concludes from their latest monitoring of these indicators that progress globally is “slow and uneven”. This can be seen from the frequency distribution below. None of the 194 countries that WHO includes in its report has “fully achieved” all 19 indicators to reduce and manage NCDs (although most are recorded as “partially achieving” at least some of the indicators). Indeed, the best result globally was that only two countries – Costa Rica and Iran – “fully achieved” 15 of the 19 indicators. The modal group (i.e. greatest frequency, in this case involving 38 countries globally) “fully achieved” just 4 of the 19 possible indicators.
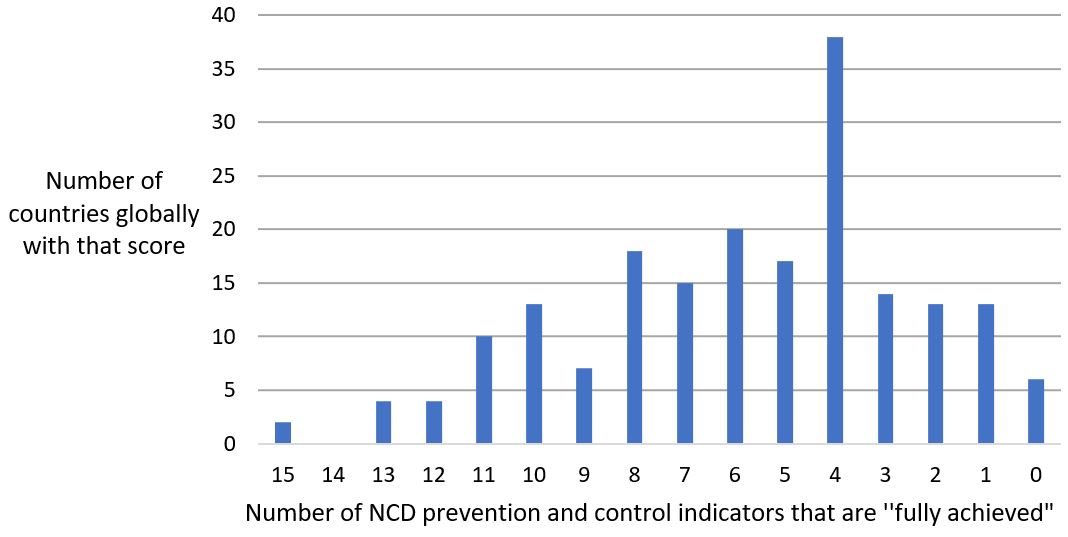
Table 2 below extracts the performance for countries in Asia and the Pacific. It shows that Thailand was the best performing country in the Asia Pacific region, with 12 out of 19 indicators “fully achieved”, putting it in the top 5% of countries . Most Asian countries are in the top half of countries by this metric, but the largest group of countries from Asia and the Pacific was only able to “fully achieve” 4 of the 19 indicators, putting them into the bottom quarter. Cambodia, Kiribati, Myanmar, Nauru, Samoa, Solomon Islands, Timor-Leste, and Tonga were all in this category.
Fiji and Vanuatu are the best performing Pacific countries, but both manage only just to make it into the top half. All other Pacific countries are in the bottom quarter, and three (Tuvalu, PNG and FSM) are in the bottom 10%. A separate blog will look at the relatively poor performance of the Pacific.
Table 2: Achievement of progress indicators to respond to NCDs in Asia and the Pacific in 2015