
On 30 May 2019, James Marape replaced Peter O’Neill as the Prime Minister (PM) of Papua New Guinea (PNG). This blog does three things: first, it shows the level of fluidity in PNG politics by discussing events leading up to Marape’s election as PM; second, it compares the allocation of portfolios by party numbers and by regions under O’Neill and Marape Governments; third, it discuses the re-appointments of ministers in the Marape government.
Fluidity of PNG politics
PNG politics is fluid. In January 2019 the government voted to adjourn parliament with 88 votes to the opposition’s 23 (Figure 1). On 10 April 2019, Marape resigned as Minister for Finance as well as member of People’s National Congress (PNC) party led by O’Neill. Joining the opposition, he was nominated to replace O’Neill in a vote of no confidence when parliament met on 7 May 2019. Marape was later followed by 26 other MPs who either resigned as PNC members or left the coalition and joined the opposition, increasing numbers to 50. To avoid a vote of no confidence, the government voted again to adjourn the parliament to 28 May 2019, but this time by only 59 votes to the opposition’s 50. After the adjournment, in an attempt to attract more MPs to the opposition camp, James Marape withdrew his nomination and put the position on the table. More MPs from the coalition, including 15 MPs from the United Resource Party (URP), led by William Duma, left the government coalition to join the opposition.
In a secret ballot, the opposition nominated Patrick Pruaitch, leader of National Alliance party, as the opposition’s nominee for prime minister. When the parliament met on 28 May 2019 the opposition moved the motion to replace the Parliament Business Committee – the committee that decides the validity of the motions of no confidence. They succeeded in replacing the government MPs in the Committee with opposition MPs by 67 votes to government’s 42 votes. With a vote of no confidence against him imminent, O’Neill resigned on 29 May 2019. In turn creating a vacancy in the prime minster’s position, invalidating the vote of no confidence, and nullifying Patrick Pruaitch’s nomination as opposition candidate for prime minister.
James Marape then moved to the government side on the same day and was nominated as the government candidate to contest the vacated prime minister position the next day. On 30 May 2019, James Marape was voted prime minister by 101 votes, to Mekere Morauta’s eight votes. Mekere, who earlier supported James Marape for prime minister during the vote of no confidence attempts, was nominated as the opposition’s candidate on the floor of parliament. The sway of votes between the government and the opposition in the first half of 2019 alone goes to show how fluid PNG politics can become.
Figure 1: How MPs voted in the first five months of 2019

Ministerial portfolios under O’Neill Government (August 2017 – June 2019)
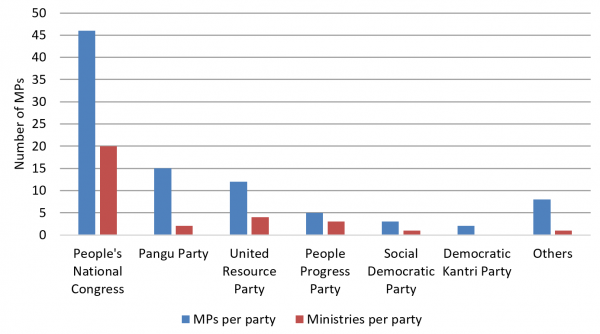
Coalitions in PNG follow the office-oriented theory, whereby the MPs and political parties form coalitions to access ministerial portfolios. The party with the largest number of MPs usually has most of the portfolios. Figure 2 show that PNC had 46 MPs and 20 ministerial portfolios under the O’Neill government, the highest number of MPs and portfolios. It is the same for the rest of the political parties that were in the coalition, except Pangu Party that had 14 MPs but only two ministries. This is because Pangu Party was in the opposition when the government was formed after the 2017 national elections and later moved to the government, putting itself at a disadvantage.
Figure 2: Political parties and portfolios – O’Neill Government
Ministerial portfolios under Marape Government (June 2019)
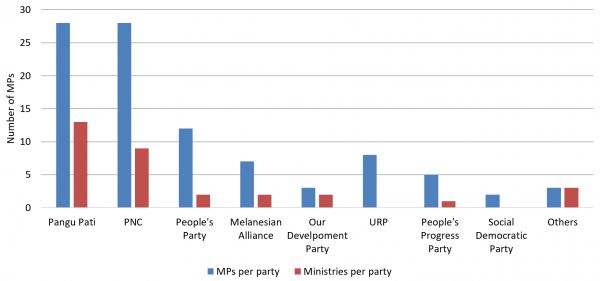
Now under Marape, the Pangu Party with 28 MPs has 13 portfolios, and PNC has 18 MPs with nine portfolios (Figure 3). However, People’s Party, Melanesian Alliance and Our Development Party each have only two ministries, even though they have 13, 6 and 3 MPs respectively. These three parties are also a construct of the crisis leading up to change in prime minister. Melanesian Alliance did not win any seats in the 2017 national elections, but seven members of Pangu Party led by Sam Basil resigned from Pangu and joined Melanesian Alliance. The other seven Pangu MPs moved to the opposition on 10 June 2019 and remained until 14 of the MPs that resigned from PNC joined them, including two from other parties. Our Resource Party also did not have any MPs until three PNC MPs resigned and revived it in June 2019. People’s Party had one MP until 11 MPs resigned from different political parties and joined it between April and June 2019. The People’s Party left the O’Neill-led coalition in May 2019. United Resource Party (URP), which did not get any portfolios, had 15 MPs but seven resigned and joined other parties, leaving eight. Marape explained that some political parties wanted more portfolios and rejected one or two portfolios he offered to them. It is possible that URP was one of those parties that negotiated for more portfolios and missed out.
Figure 3: Political parties and ministerial portfolio – Marape Government
Ministerial allocation by region
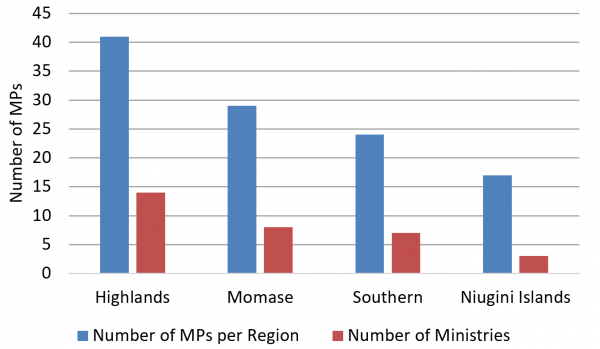
Figures 4 and 5 show portfolio distributions by region under the O’Neill and Marape Governments respectively. There are four regions in PNG: Highlands, Momase, Southern, and Niugini Islands. Both figures generally show that portfolio allocations are proportionate to the number of MPs from each region. The Highlands region, with 41 MPs (6 provincial governors and 35 open MPs), has the highest number of ministries. Niugini Highlands has the least number of MPs and ministries. The Momase region had fewer portfolios than Southern region in the O’Neill Government but more under Marape. Chimbu province was allocated four ministries by Marape – the highest –, whilst Northern Province, Western Province and Bougainville were not allocated any portfolios.
Figure 4: Allocation of ministries by region under O’Neill Government

Figure 5: Ministry portfolio allocation by region under Marape Government
Composition of Marape Cabinet
As Figure 6 shows, twenty-one out of the 32 ministers in the Marape government served under O’Neill as ministers. Nine are surviving PNC MPs whilst 12 are PNC MPs who resigned from PNC between April and June 2019. Eleven are first time ministers, and three were appointed from opposition ranks.
Figure 6: Composition of the Marape Cabinet

The fluidity displayed in the events leading up to change of prime minister is not uncommon in PNG. Despite critics arguing on social media that portfolios were not distributed fairly (for instance, that Northern Province, Western Province and Bougainville did not receive any portfolios), by region, the ministries are proportionate to number of MPs. As a province, Chimbu province is the biggest winner with four of its seven MPs given portfolios. As a region, Momase gained with three more ministers than were allocated under the previous government. MPs that joined Pangu had higher chances of being allocated portfolios. The biggest losers in terms of ministerial representation are URP (from four to no ministers) and People’s Party (12 MPs but only 2 ministers).

Thanks Michael for this commentary
PNG Politics is always fluid, never at one time will it be smooth and fixed. This was always noted by former PNG political commentators and analysts like Dr Anere, Dr Okolo and Dr Hegarty. PNG is a fluid democracy that survive for over 40 years now.
When you look critically at the demise of O’Neill and rise of Marabe, it has more to do with the unconventional political realm than the conventional party politics in a Westminster system.
Why the O’Neill government changed depends on the views the general population and the MPs on both sides of the House have on the socio-economic and law and order dynamics of the country, and how it was governed. PM Marabe seized this opportunity.
How the new PM allocates portfolios, depends on unconventional political realm like Party influence based on numbers, not on party policies. Based on individual, regional and provincial conveniences and not based on competency to govern.
That would explain why the PM allocates more MPs to the Highlands or more to Chimbu. Or why he pulled two strong opposition men into the government side and served them with portfolios.
The new PM also considers representation in cabinet and ensuring that key parties have a voice in there; that is where the new minister for foreign affairs comes in as a voice from the gas resource province.
Another unconventional impact is the unseen influence from key players in the making or breaking of government – evidently their interest and offer needs to be entertained.
As a political analyst, you investigate the formation of this current government. You will prove me right by agreeing with me that the PM, and deputy PM positions, are between Hela and Enga. Not what used to be previously along regional representation after general election or after a vote of no confidence in PNG history.
Dear Michael, I take time out from my schedule to provide my comments and thoughts on your article.
Firstly, I think it is a useful and insightful article and could be improved further particularly in understanding the motives of Members of Parliament in voting or moving from one party to the next during the grace period leading up to a possible vote of no confidence.
Secondly, while I do concur that PNG politics is fluid especially before, during, and after a vote of no confidence. I think politics in Milne Bay is even more fluid and unpredictable given that not everyone finds their MP ‘their professed cup of tea’, to phrase it rather politely.
Thirdly, I believe that this article is a good one and should be further strengthened by uncovering why MPs behave the way they do. Is it do to with party affiliations or political views shared fairly broadly in their own constituency?
Cheers bro!
A useful effort …….. thanks Michael (fatason).
Present analysis shows a trend, perhaps you may look at past governments for comparative purpose to develop insights into their role in regional and party politics.
Good day Micheal, an interesting piece, indeed. The analysis appears to be a descriptive one. What is missing is the political motive that led to a political outcome. Politics is all about strategically maneuvering the game to achieve power. I hope this could be more clear in this analysis.
Hi Francis, you’re right. Due to word limit requirement (1000 words or less) I couldn’t go into the motives & reasons behind MPs’ movements. I hope to do it later as a follow up.
Hello Micheal,
This is an interesting piece. I enjoyed reading it since it puts the events and decisions of what had happened over the past few months and PNG politics into better perspective.
I have only one question-
Since you make the claim that regions with more MPs receive more than those that have less, why were there less ministries given to the MOMASE region and more to the Papuan region during the O’Neil era? Where most of them with the Opposition?
Hi Francis, the Southern (Papua) region having lower portfolio allocation under O’Neil era is consistent with the conclusion that regions with lower number of MPs are given proportionally less portfolios. Momase’s case may be explained by what you suggest. Perhaps most of Momase MPs were in the opposition. I didn’t think about that the time of writing.
Party numbers and regional considerations plays a big part in portfolio allocations. We know this because O’Neil said on at least two occasions (both after government formations in 2012 and 2017) that they allocated portfolios “fairly”, meaning, they considered regions. Some take that to mean portfolios are/should be equally divided among the 4 regions. Data shows it’s the number of MPs from each region that determines “fair” distributions. Number of party members plays the main role in how many portfolios each party gets.
It is possible that, after portfolio distribution is agreed based on party numbers, the actual allocation then is based on the region they represent. For instance PNC had 46 MPs, 20 portfolios were allocated to PNC. The highlands region then gets most of the portfolios allocated to PNC because the region has most number of MPs in these parliament? Worth investigating.