

The Center for Global Development (CGD) recently found that Australia has the third-best migration policies among 27 developed countries, after New Zealand and Norway, from a development perspective. A year ago, CGD ranked Australia almost as high, in fifth position.
Given the forceful and ongoing criticism of certain of Australia’s migration policies from sources as varied as The New York Times and the president of Australia’s own Human Rights Commission, Gillian Triggs, how could this be?
The short answer is that migration polices can be viewed through two quite different lenses: an economic development lens, and a humanitarian lens. The CGD rankings do not entirely neglect the latter, but heavily favour the former.
This post looks specifically at the humanitarian lens as applied to the case of Australia (more on the economic development lens another time). It finds that CGD’s approach is deficient in all three of the ways it could be deficient—it marks Australia too high for the humanitarian impact of its migration policies in one of the several areas it chooses to measure, it chooses not to measure some important things, and it gives too little weight to humanitarian impacts in its overall assessment of migration policies.
CGD assesses and ranks developed countries’ migration policies as part its annual Commitment to Development Index (CDI) assessment process. The 2016 CDI results, which will look at performance in seven policy domains (including aid), are due to be released later this month. CGD pre-released an overview of the migration policy rankings on 16 September, just before the twin refugee summits in New York. Australia’s delegations to those events, if they noticed, must have been mildly thankful.
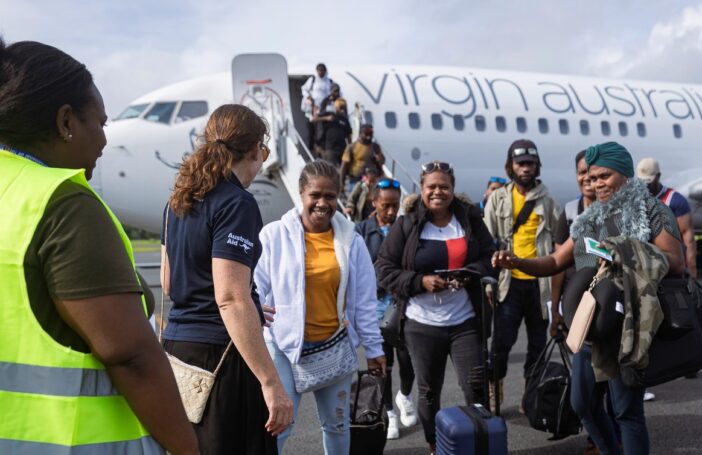
Until now, the Australian government has doggedly highlighted another, even more favourable ranking. Australia has, as Peter Dutton and other members of the government like to say, the third-largest refugee resettlement program in the world, and the most generous of all if one considers refugees resettled per capita. I have previously argued that that claim is selective and disingenuous. Gillian Triggs has described it as ‘profoundly misleading’.
The CGD migration policy ranking is not, as might be assumed, based to any great extent on the size of the government’s refugee resettlement program. To its credit, CGD’s assessment is completely indifferent to the manner in which refugees and asylum seekers arrive in developed countries. Of the refugees who actually find homes outside their own countries, only a tiny minority (3.2% in 2014) do so through formal refugee resettlement programs like Australia’s. Countries with large organic inflows of asylum seekers see little point in establishing such programs.
The CGD migration policy ranking is, rather, based on Australia’s performance with respect to six, wide-ranging components as pictured in Figure 1 (which shows 2015 scores since CGD has not yet released 2016 scores for individual components).
Figure 1: Components of the CDI’s migration policy sub-index
(with Australia’s 2015 scores)
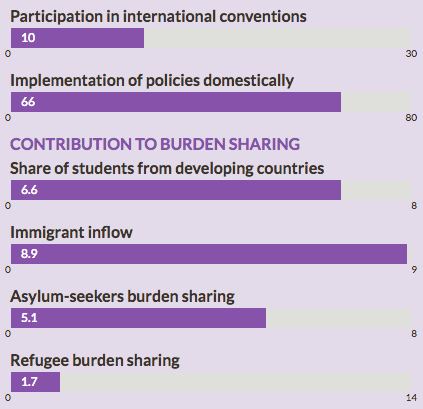
The last two components—relating to asylum-seekers and refugees—constitute the humanitarian lens as interpreted by CGD. Australia’s score on each component in the previous assessment from 2015 is shown in white on the left-hand side of the graphic, with the maximum score on the right-hand side.[1] Below I discuss the asylum-seekers and refugee components in turn, before turning to the question of compliance with relevant international agreements.
Asylum-seekers burden sharing
A country’s score on this component depends on two things: how many asylum-seekers it hosts per capita, and how many asylum claims are accepted as a share of total applications. Australia’s score in the 2015 CGD assessment was 5.1 out of 8, as compared with an average of 5.2 across all countries assessed.
According to the most recent internationally comparable data, from the UN Refugee Agency (UNHCR) 2014 Statistical Yearbook, Australia’s stock of asylum-seekers at the end of 2014 was 21,518, which is equivalent to 0.09% of Australia’s population.[2] These are for the most part ‘Irregular Maritime Arrivals’ (IMAs) who entered Australia before the blanket enforcement of mandatory offshore detention from late 2013.[3] As Figure 2 shows, Australia ranked 11th in the OECD in 2014 in terms of asylum-seekers per head of host country population. Its ratio was just above the average for the OECD as a whole, which is 0.07%.
Figure 2: Asylum seekers as a proportion of host country population,
OECD countries, 2014
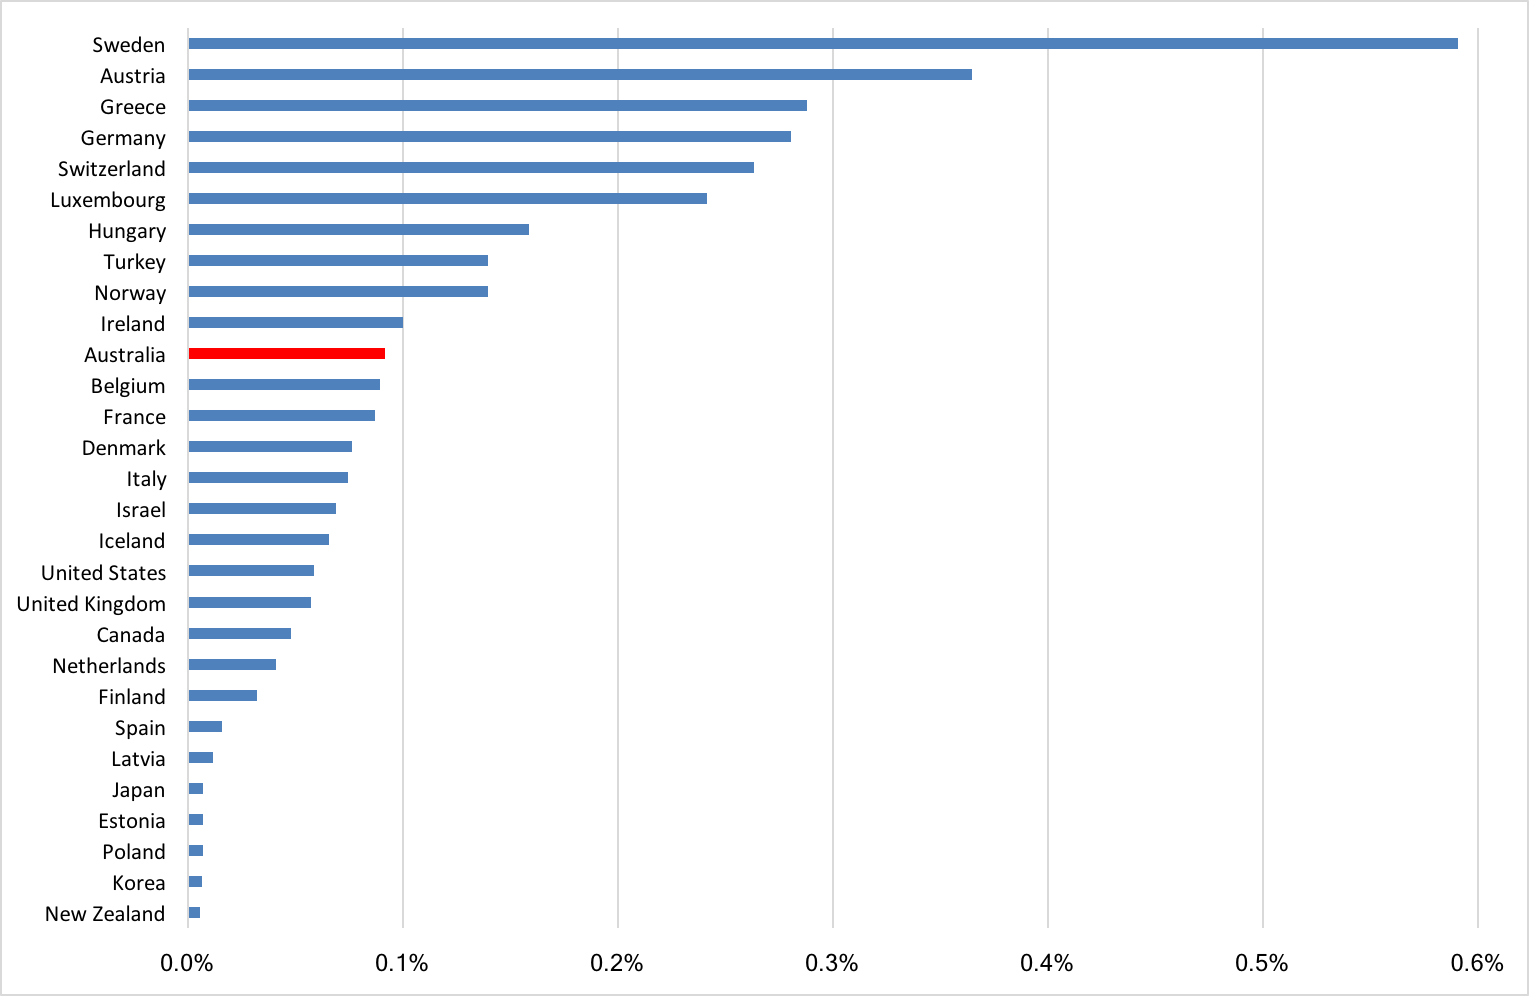
Source: UNHCR Statistical Yearbook 2014, Table 1, OECD population statistics and author calculations.[4]
CGD’s 2015 assessment was presumably based on 2013 UNHCR data, and in 2013 the stock of asylum-seekers was quite a bit lower, at 13,559. IMAs peaked (at over 18,000) in fiscal year 2012-13, and were still high by historical standards in 2013-14 (over 9,000). Hence the net increase of some 8,000 people in 2014. However, even with this substantially larger stock of asylum-seekers, the number of asylum-seekers per capita in Australia was only slightly above the OECD average in 2014. So Australia’s 2015 score looks to be higher than it should be, particularly in view of the fact that CGD takes not only host country population but also land area into account.
Could it be, though, that Australia tends to perform well above average on the other element of this component—the number of asylum claims accepted as a share of total applications? In fact, Australia does not excel in acceptance of claims. According to UNHCR statistics, Australia made 13,399 status determinations in 2014, of which 2,540 were positive (this includes both decisions on new applications and decisions on appeal)—a within-year acceptance ratio of 19% compared with an OECD average of 34%.[5] As can be seen in the figure below, Australia ranks a lowly 23rd in the OECD on this measure.
Figure 3: Positive decisions on asylum claims, OECD countries, 2014
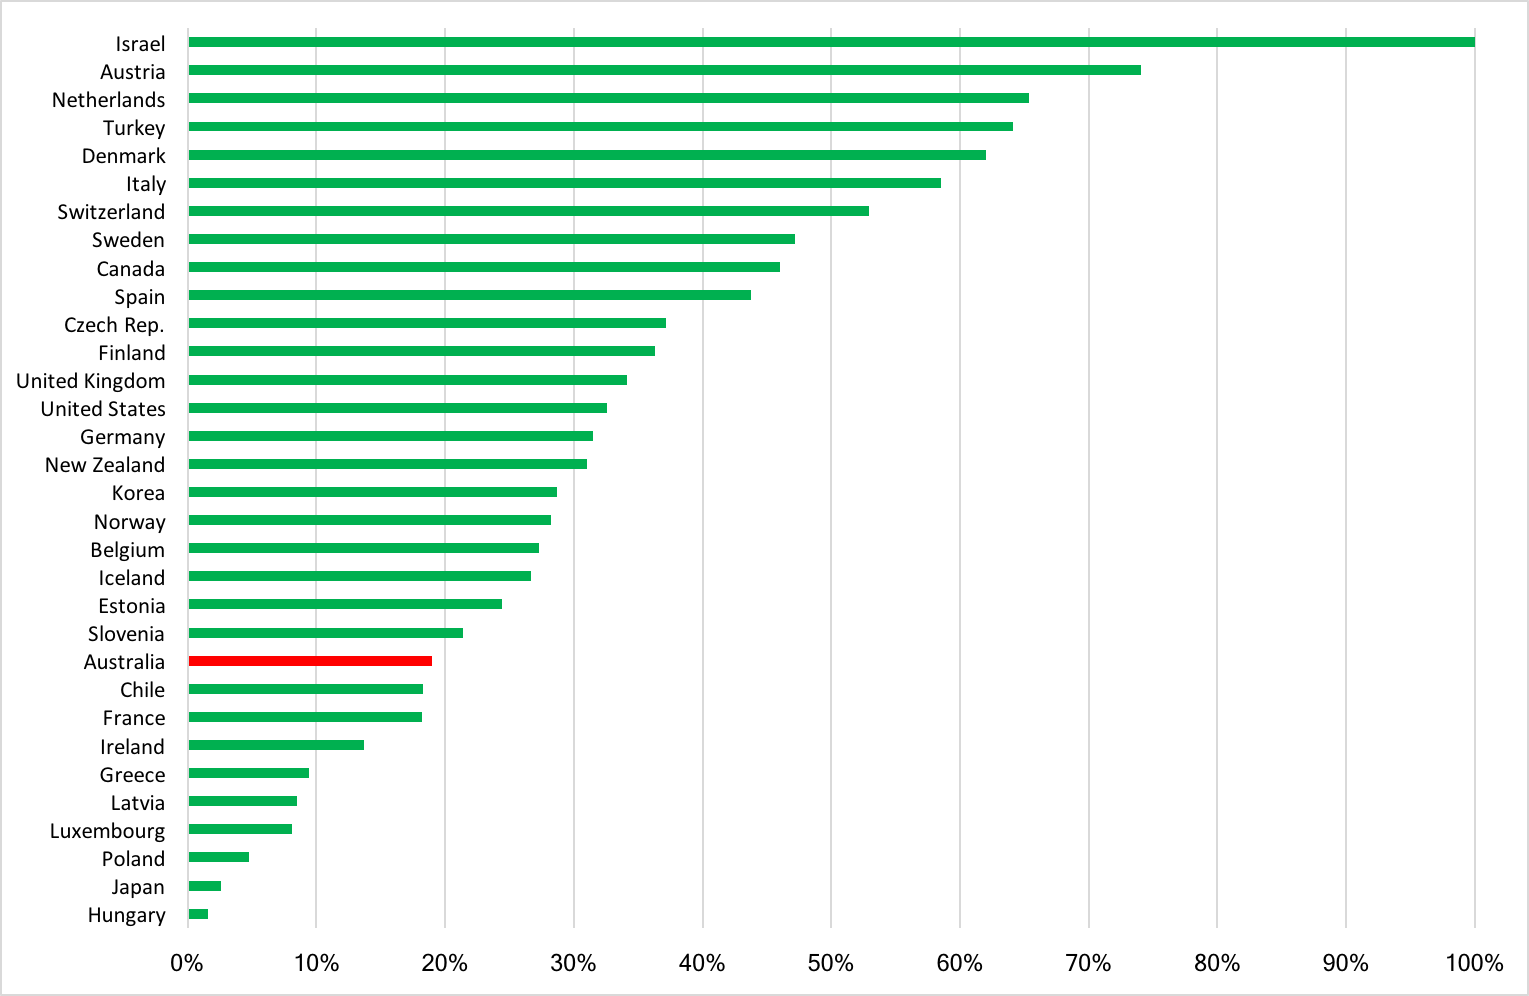
Source: UNHCR Statistical Yearbook 2014, Table 10, and author calculations.
Australia’s score on the ‘asylum-seekers burden sharing’ component in CGD’s 2015 assessment can only have been depressed, not inflated, by its performance in relation to acceptance of claims. While the 2016 score ought to be a little higher owing to the increase in the stock of asylum seekers, the 2015 baseline should have been well below average rather than, as it was, about average.
Refugee burden sharing
A country’s score on this component depends on the number of refugees it accepts in relation to its GDP, its population and its land area. Australia’s score in the 2015 CGD assessment was 1.7 out of 14, as compared with an average of 4.1 across all countries assessed. That seems to be about on the mark. Australia takes a relatively small share of the world’s refugees—currently around 14,000 per annum, plus a trickle of Syrians and Iraqis on an exceptional basis, as compared with a global pool of more than 20 million and a global recognition and resettlement figure of some 3.4 million per annum (for data, see here, Table 3 and Table 23).
However, this modest performance, like Australia’s performance on measures related to asylum-seekers, does not appear to have exerted much gravitational pull on Australia’s aggregate migration policy score. To understand why not, we would need to know what weight is assigned to these measures in the calculation of the overall score. It’s not easy to find this out because, in recent years, CGD has ceased showing its workings. The last assessment for which one can access the underlying data and calculations is that from 2013.[6] A very thorough technical note from the same year did provide weightings but they related to measures that in many cases appear to have been substantially modified since that time.[7]
According to the technical note just mentioned, CGD’s 2013 assessment assigned a total weighting of 20% to the humanitarian components, as they were at that time, of the migration policy sub-index. While the components have since changed, it seems likely that this is still about the weight given to the humanitarian lens. It’s a remarkably low weight, which explains why Australia can be mediocre on asylum-seekers and poor on refugees without suffering much damage to its overall score.
International conventions
Under this component of the migration policy sub-index, a country gets 10 points towards a possible 30 for ratifying each of several international agreements on the protection of migrants. The 1951 UN Refugee Convention is not among them, reflecting the fact that CGD’s interest here is mainly in the rights of migrant workers. Indeed, CGD does not see this particular component in humanitarian terms. Omission of the Refugee Convention could be viewed as unfortunate given that Australia has regularly been accused of failing to meet its obligations under the Convention, particularly its non-refoulement obligation.
The 2000 Protocol to Prevent, Suppress and Punish Trafficking in Persons is among the agreements considered, and Australia has ratified it (hence Australia’s score or 10 out of 30 in the 2015 assessment).[8] However, Australia has been accused of trafficking in persons by paying people smugglers (possibly via its legally immune foreign intelligence arm), to return asylum-seekers to their ports of proximate origin.
Regardless of the merits of the above complaints against Australia, this situation suggests two things. First, if international conventions are to be considered at all, it makes no sense to exclude major agreements bearing on the treatment of refugees and asylum-seekers. Those would include not only the Refugee Convention, but also the Convention against Torture and the Convention on the Rights of the Child, all of which Australia has been accused of breaching in its treatment of asylum-seekers.
And second, ratification is hardly to the point; some measure of compliance is needed. CGD can hardly be expected to adjudicate on accusations of refoulement or torture, but one could imagine the use of some objective benchmarks for determining whether asylum-seekers are being treated fairly and humanely. Are all asylum-seekers given equitable access to a transparent status determination system and to basic social and legal services? Are claims processed in a timely fashion? Is detention, where it occurs, indefinite? Are children held in detention? Where a government causes people to be detained in third countries, does it accept a duty of care? Can asylum-seekers living in the community undertake paid employment? And so on.
The CDI’s migration policy sub-index appears, on the basis of the most recent data and CGD’s previous assessment, much too generous to Australia on asylum-seekers burden sharing. It looks about right on refugee burden sharing, but seems to attach far too little weight to performance on both this and the previous measure in determining an overall score. In addition, it omits any measure of compliance with relevant international agreements. (Reduced methodological transparency since 2013 is a further but separate problem.)
When a yardstick indicates that Australia has the third-best migration policies in the developed world, from an international development perspective, it’s probably time for a new yardstick.
Update: It has come to my attention that CGD’s Owen Barder published this defence of Australia’s ranking shortly before the above post was published (though after it was written). In it, he states that the number of asylum seekers and refugees a country accepts counts for one-quarter of its overall score on the migration component of the CDI, only slightly higher than the 20% figure given in the 2013 technical paper.
Robin Davies is the Associate Director of the Development Policy Centre.
[1] If you go to the interactive web page from which the above screen shot is taken, there are information balloons explaining, very briefly, what’s going on in each sub-component.
[2] The stock of asylum-seekers is currently almost 30,000, but has been gradually declining since late 2015 given the cessation of boat arrivals and near-constancy in the number of air arrivals (around 8,000 per annum). The people forcibly relocated to Papua New Guinea and Nauru are not counted toward Australia’s stock.
[3] The government prefers the term ‘Illegal Maritime Arrivals’.
[4] Several countries with near-zero ratios and small stocks of asylum seekers have been omitted to aid readability.
[5] It should be noted that the ultimate outcomes for asylum-seekers in Australia are better than these figures suggest. The UNHCR’s statistics necessarily relate to the outcomes of decisions taken over a fixed period of time, one year, but many asylum-seekers achieve an outcome only after multiple appeals over several years. In Australia, around 45% of asylum claims are ultimately determined to be well founded in the case of people arriving by air, and over 90% in the case of IMAs. There are no comparable statistics on final outcomes across the OECD but it is likely that in other countries the situation is much the same.
[6] Links to the 2013 spreadsheet and earlier ones back to 2003 are provided in this web page. (The link to the 2012 spreadsheet is broken.)
[7] For example, in the 2013 assessment CGD calculated a country’s ‘refugee burden sharing’ score by adding ‘persons of concern’ (to UNHCR, that is) and ‘asylum applications’, then dividing by GDP. In more recent assessments, they calculate refugee burden sharing and asylum-seeker burden sharing separately, using the simple methodology described in the body of the post above. This is much better, as the 2013 methodology was mystifying. The UNHCR ‘persons of concern’ category includes both refugees and asylum-seekers and is a stock measure. ‘Asylum applications’ is a flow measure because the applications reported are all lodged in a single calendar year. A proportion of these applications will have come from people already in the ‘persons of concern’ category. Adding the values of these quite different variables is strange.
[8] The other two agreements considered are the International Labour Organisation’s 1949 Convention concerning Migration for Employment and its 1975 Convention concerning Migrations in Abusive Conditions and the Promotion of Equality of Opportunity and Treatment of Migrant Workers.


I think there might be an additional issue in the CDI methodology Robin that inflates Australia’s development contribution via migration. It appears that several of the CDI components appear to treat all DAC recipient countries the same whether they are low income or upper middle income.
For example with the Migration component, in Australia’s case only one of the top ten sources of migrants and of foreign students is a low income country (Nepal), and many of the rest are upper middle income countries, yet it appears migrants and students from both these types of countries are given the same weighting. (https://www.border.gov.au/about/reports-publications/research-statistics/statistics/live-in-australia/migration-programme/trends-2013-14).
Garth — I decided to look at other components of the migration policy sub-index separately, in another post to come, but I did recently investigate your point above. According to the fine print, ‘countries are more rewarded for accepting migrants from poor countries, rather than relatively rich countries’. That’s from the 2015 assessment. Going back to 2013, the technical paper by David Roodman (to which there’s a link in the post) says that gross immigrant inflows are ‘weighted by poverty discount of sending countries, using multipliers …Thus, immigration from Haiti is discounted less than that from Estonia’. It’s not clear, even from the 2013 spreadsheet, how the multipliers actually work. And once you start weighting, things get tricky. For example, many small island states are upper middle-income, but surely we wouldn’t want to weight migration from Estonia the same as migration from Tonga.
You’re right Robin – it is more complicated and the published material is a bit unclear on this. The 2013 spreadsheet says it weights the migration score using “poverty rates from aid component” but is not clear whether this means the “aid selectivity” weighting which includes a good governance factor. The student score appears to largely ignore income groups and count all non-CDI countries the same.
I agree we wouldn’t want to weight migration from Estonia the same as that from Tonga but I am a bit confused by your example. For me the reason for giving greater weight to Tongan immigration is because Tonga’s per capita income is just one fifth that of Estonia’s. I don’t think that Tonga’s proximity to Australia or small size is so relevant in a global commitment to development index.
Yes, the example was off the mark. My intention was to compare Tonga to some other, more robust upper-middle income country but I unthinkingly named Estonia, a high-income country, since it had been mentioned in the previously quoted CGD technical note. In any case, my point is that weighting by income categories alone seems too blunt. My own inclination is not to weight, but if weights are used I would think migration from small and fragile UMICs should be given greater weight than migration from large and robust ones.