

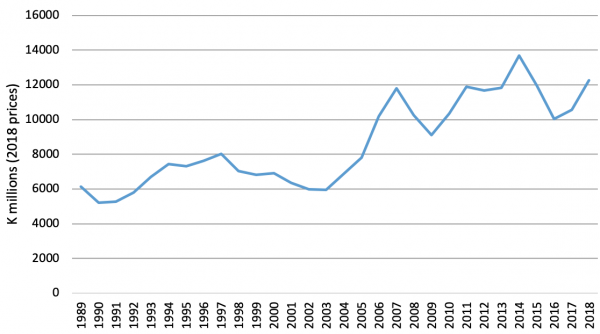
PNG’s 2018 Final Budget Outcome, released in April, shows that government revenue increased sharply last year. Not taking into account donor grants, revenues increased by 21.5%, which, after inflation, is the second highest single-year increase in the last three decades (the highest was in 2006). This is good news, as the government in previous years has struggled with revenue at crisis levels. That said, the rise reflects one-off adjustments, and it is too early to say that things are back on track.
Figure 1: Revenue (excluding donor grants) 1989-2018
There are three taxes we can look at that reflect growth in the non-resource sector – where most Papua New Guineans work. Personal income tax, which reflects employment and wage growth, company tax, which reflects private sector growth, and GST, which reflects consumption. GST revenue grew by 5.7% (after inflation), about half the average year-on-year rate of growth since its creation in 1999. Company tax revenue grew by 3%, also around half the average rate of growth over the same time period. Income tax declined in real terms. There was a bill tabled in the 2018 budget to reduce the income tax on termination of employment payments, however the reduction in income tax is also consistent with a fall in formal sector employment. This is a disappointing result, though roughly in line with expectations from the initial budget.
Figure 2: Broad-based taxes 1989-2018

Other economy-wide taxes also increased. After inflation, import-related taxes increased by 54% compared to 2017, and export-related taxes by 26%.
Figure 3 shows the movement in export and import value each quarter since 2010. A number of tariffs were increased in 2018, and this may be driving increased import-related revenues, as imports compressed further in the first three quarters of 2018. The value of exports in the first three quarters of 2018 is roughly the same as in the first three quarters of 2017. We will have to wait for the release of results by the Bank of PNG to confirm whether there was a substantial boost to exports in quarter four to explain the increase in export-related taxes. Though this seems plausible due to the holding of the APEC leaders meeting in November.
Figure 3 shows a comparison between imports and exports, excluding LNG, which is a useful distinction, given the extraordinary size of the LNG project and its related exports.
Figure 3: Import and export value by quarter, Q1 2010 – Q3 2018

Overall, revenue from economy-wide taxes increased, but only by K260 million, or 3%, after inflation. More important were the boosts in resource revenues, and in non-tax revenue.
Figure 4: Break-up of revenue sources by category (excluding donor grants)
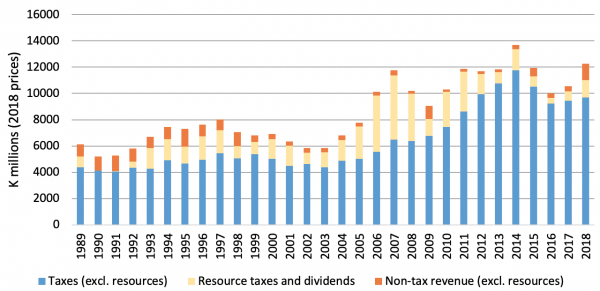
Non-tax non-resource revenue reached its second highest level ever, increasing by K820 million, or 206%, after inflation. The new policy forcing statutory authorities to hand over most of what they earn worked well, with the National Fisheries Authority in particular having to hand over hundreds of millions of Kina. In all, state services and statutory authorities provided around half a billion Kina to the budget in 2018, or around 5% of total revenue, up from less than one million the prior year!
Resource revenues (from taxes and dividends) are still low by historical standards, but are recovering after severe compression in 2016. Compared to the prior year, in 2018 they increased by K622 million, or 88%, after inflation.
Total revenue is higher in 2018 than was expected in the 2018 budget, however, as shown in Figure 5, expenditure was also higher than budgeted. The value of the increase in expenditure is lock-step with the increase in revenue.
Figure 5 Revenue and expenditure 1989-2018
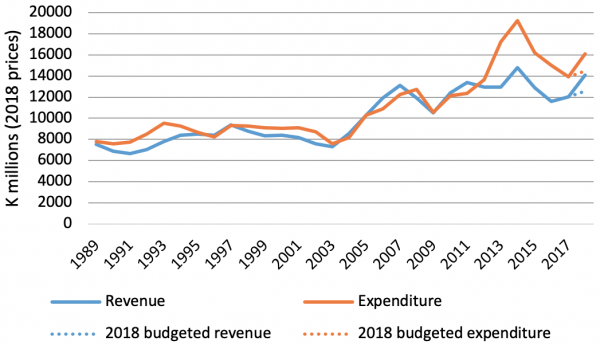
The government has successfully found ways to increase its revenue, something necessary to improve its budget situation. However, the growth in revenue hasn’t been due to a recovery in the non-resource economy, which would affect the lives of the majority of Papua New Guineans. The stronger performance has largely been due to better performance from the resource sector, higher tax revenue from international trade, and a one-off increase in the contribution to the budget from statutory authorities. Neither the PNG budget nor the economy is out of the woods yet.
The PNG Budget Database has been updated to include the 2018 FBO and is available here.


Hi Rohan, are we even sure that the increased dividends from statutory authorities are being paid out of earnings, or is it possible they are being paid out of new borrowing?
Cheers
Tony